RAPID Q2 Overview
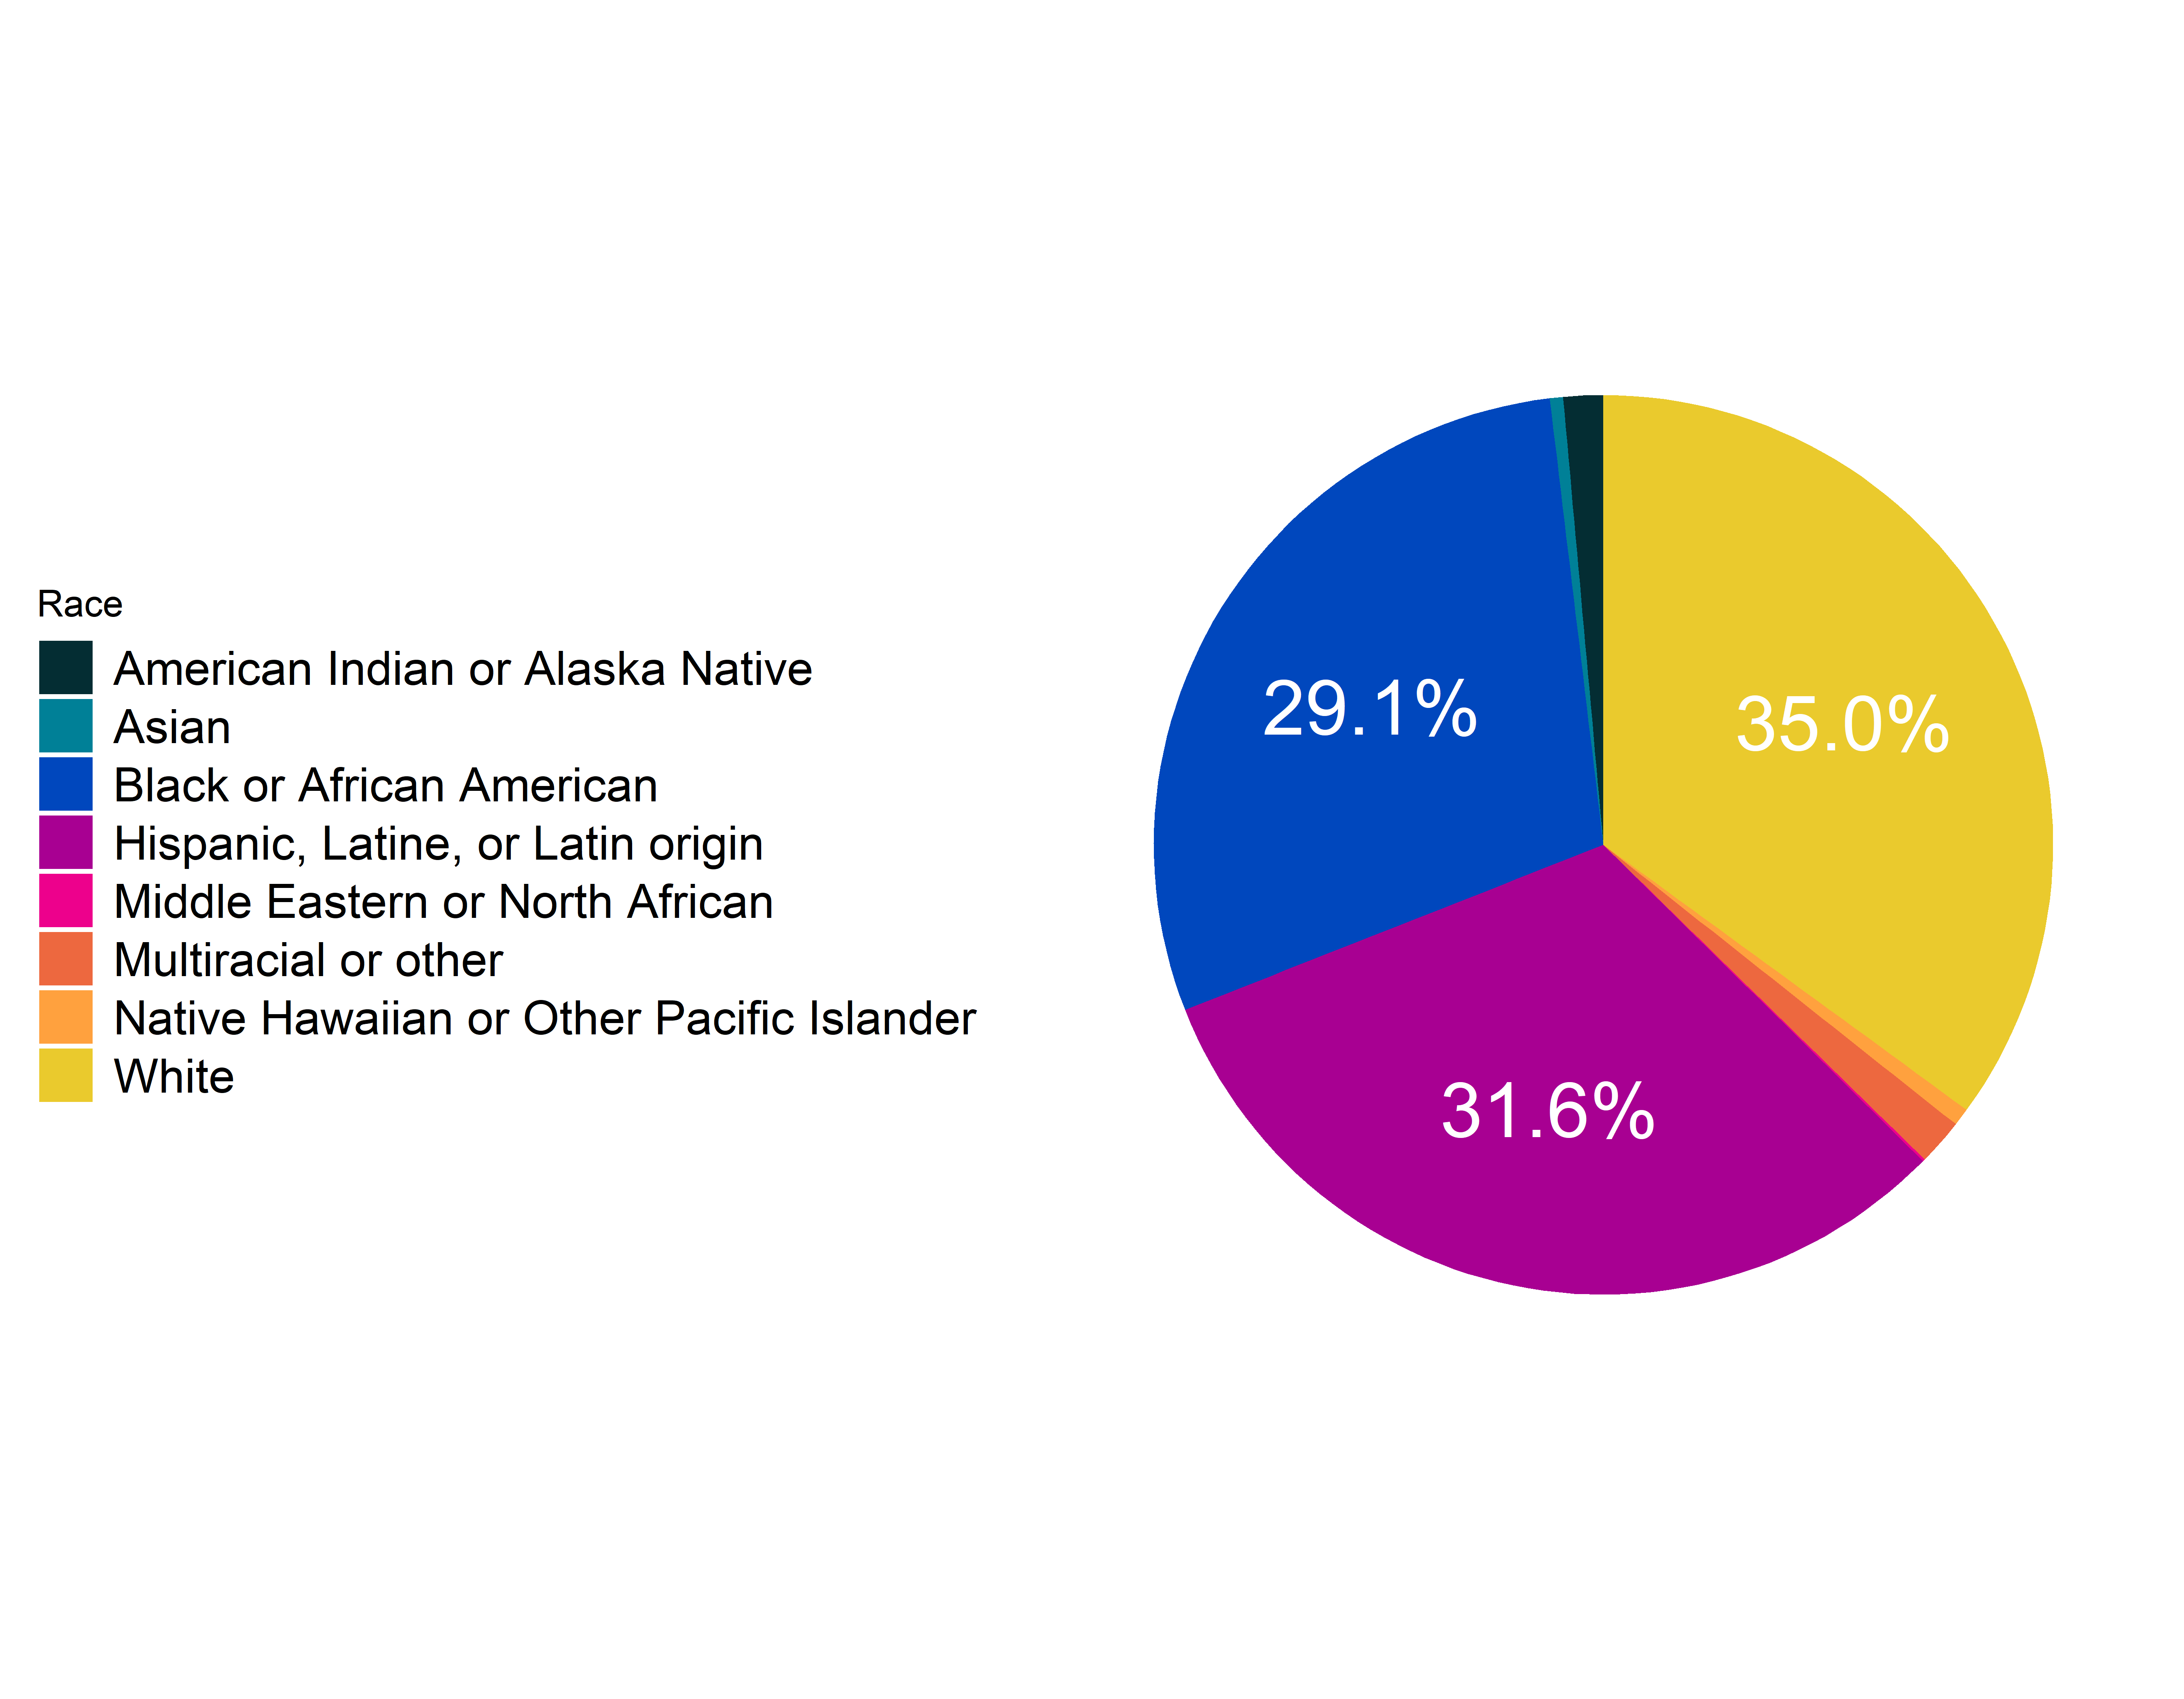
Distribution of Respondents by Race
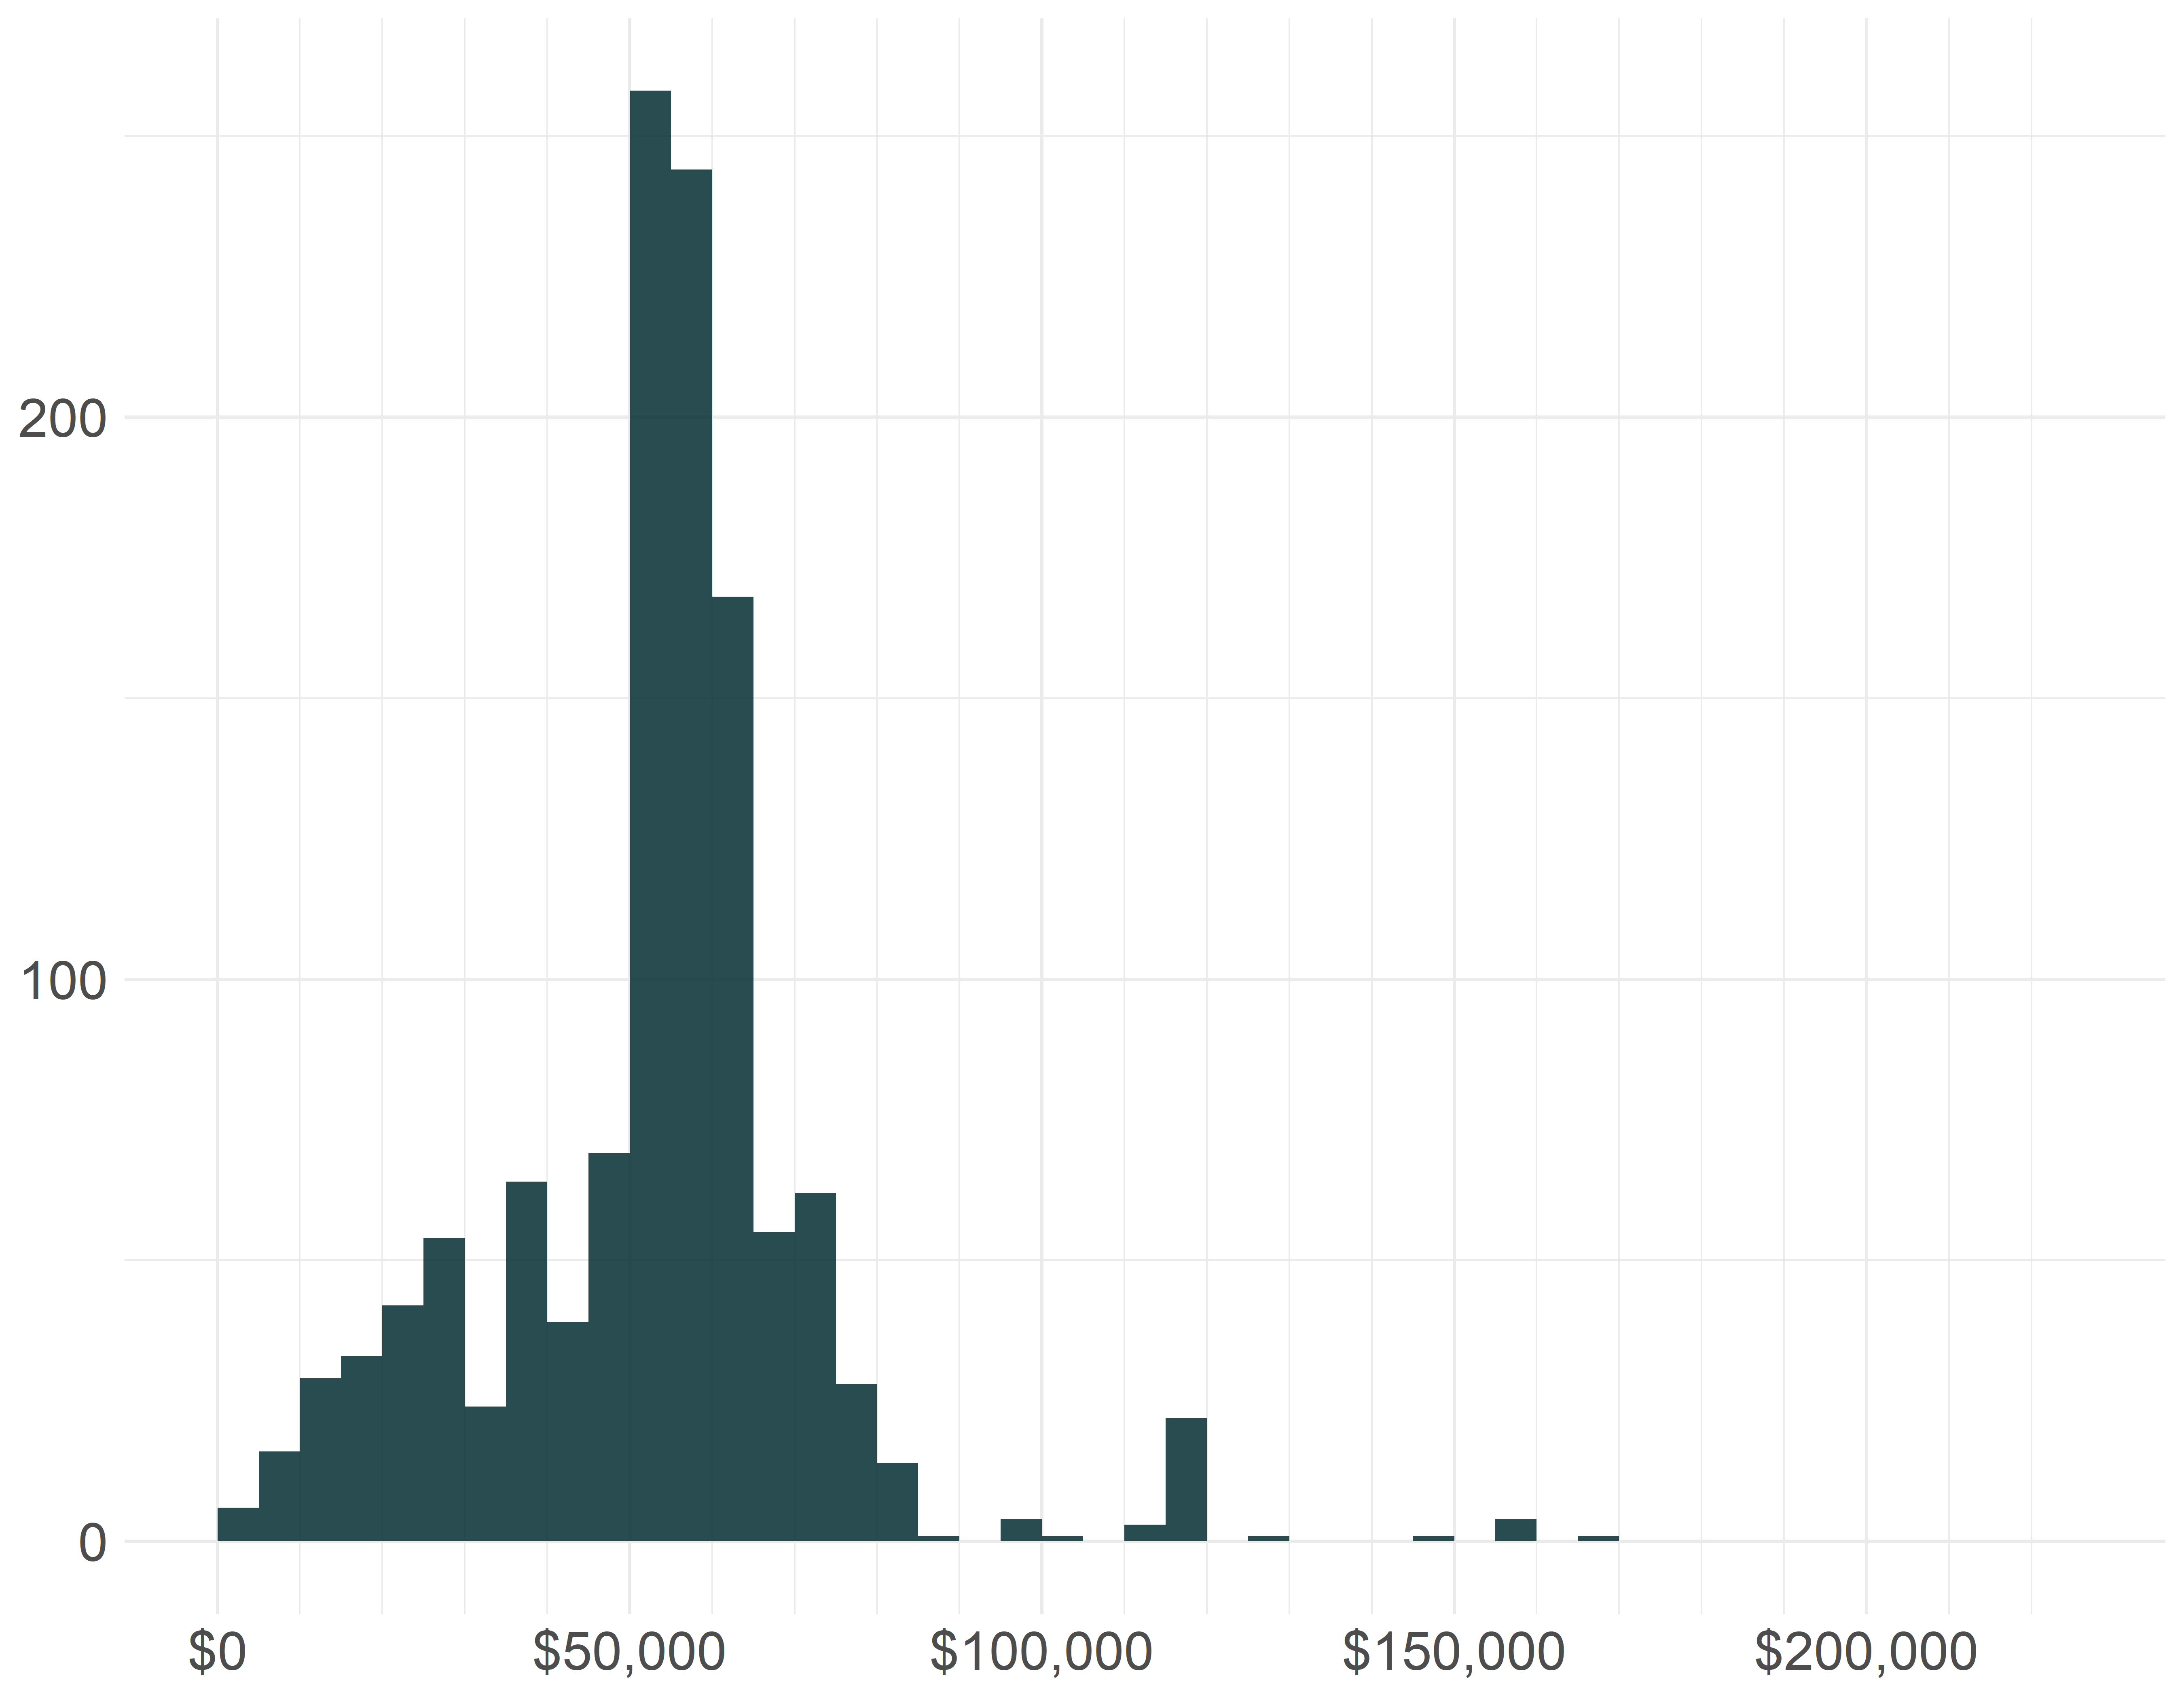
Income Distribution of Respondents (Under $200,000)
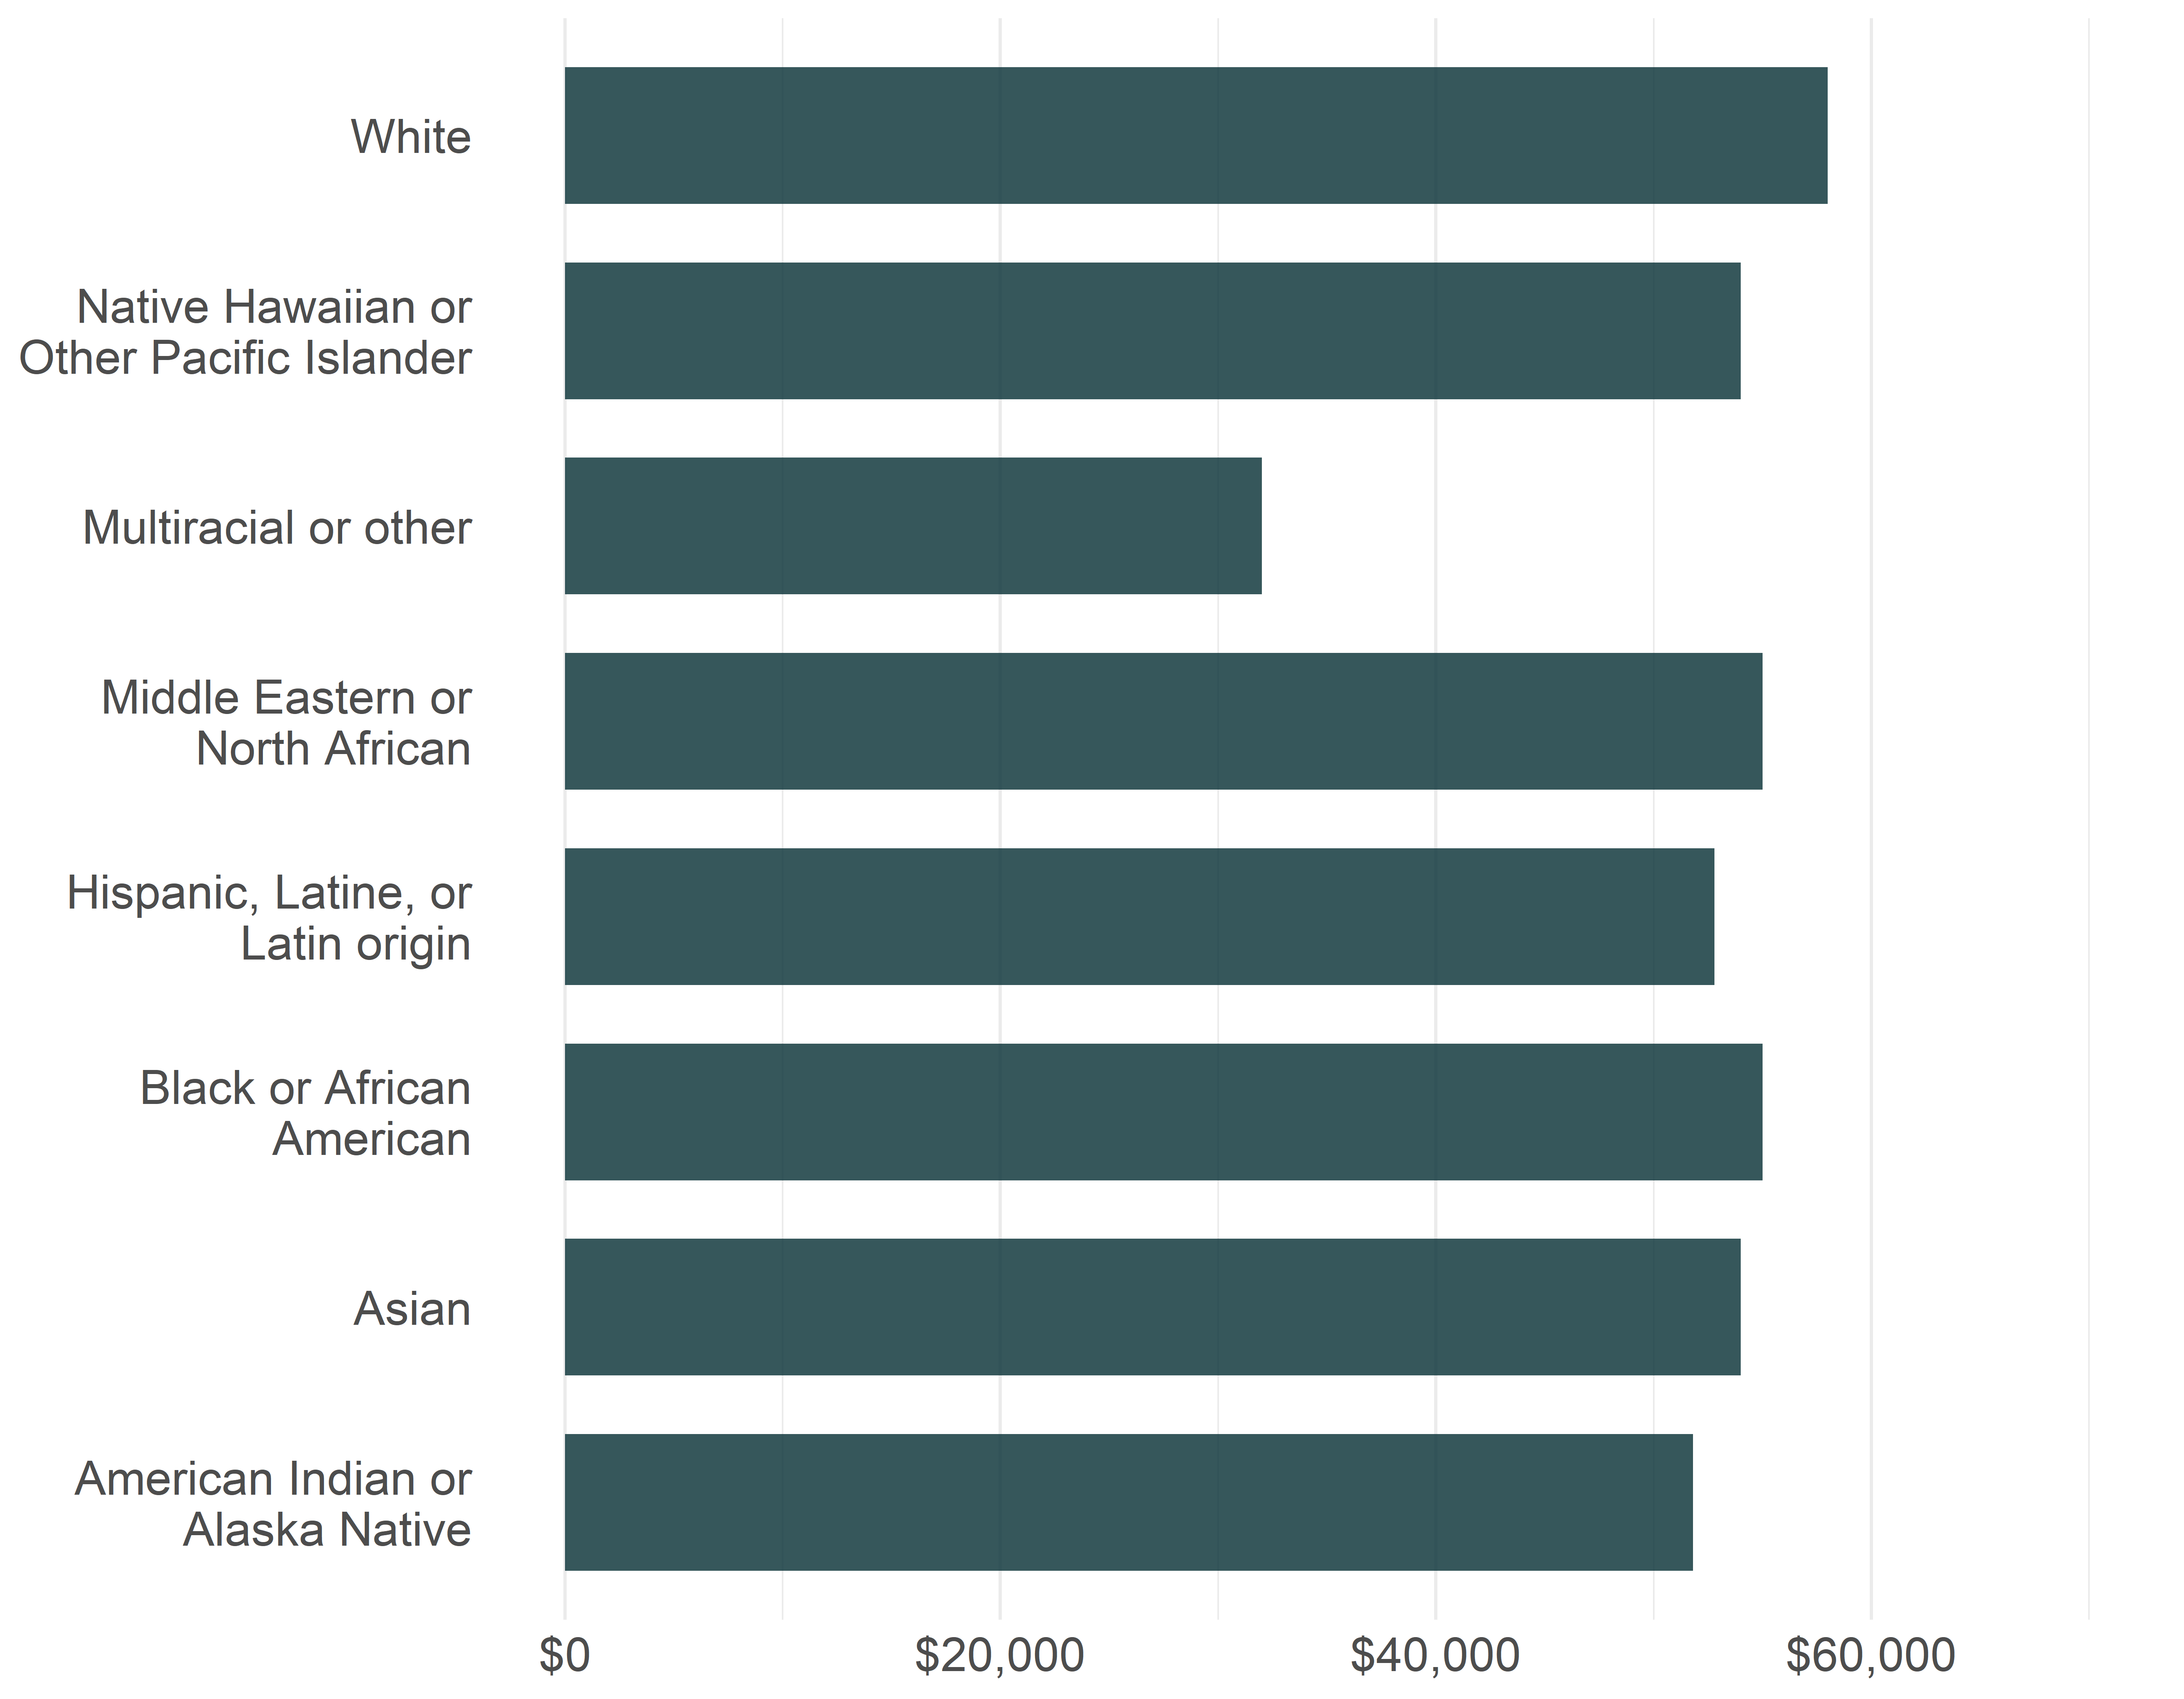
Median Income of Respondents by Race
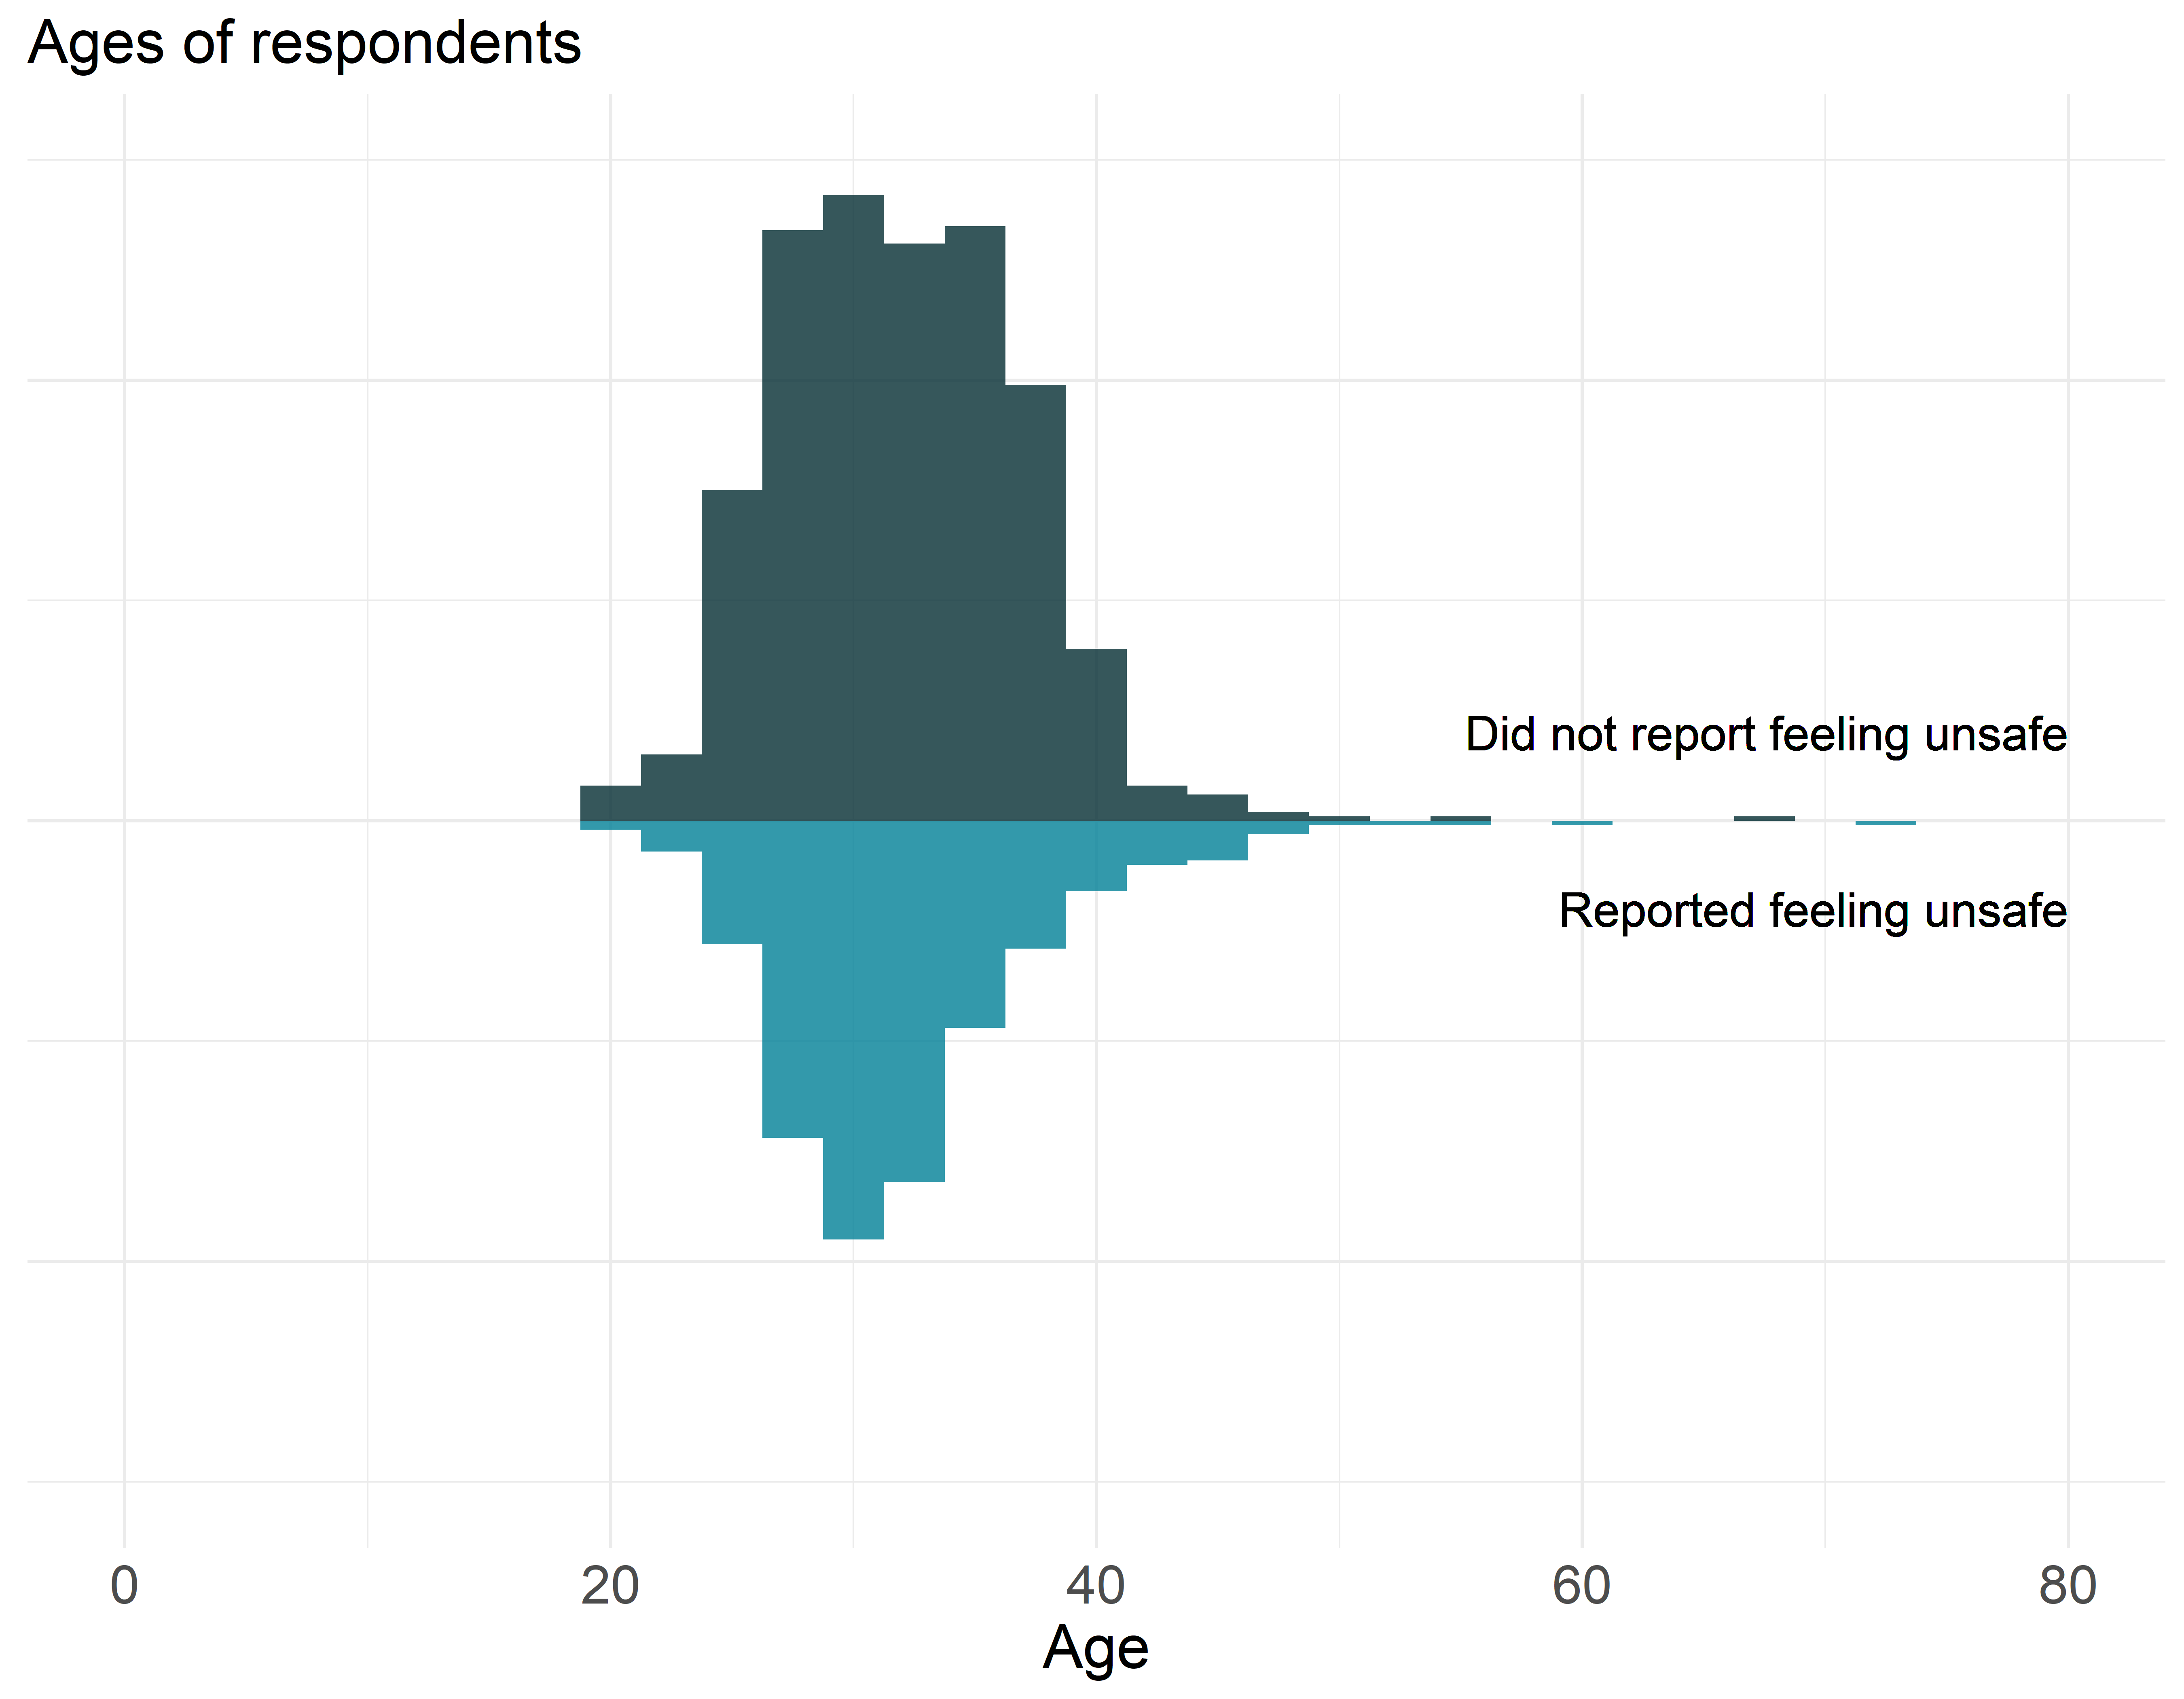
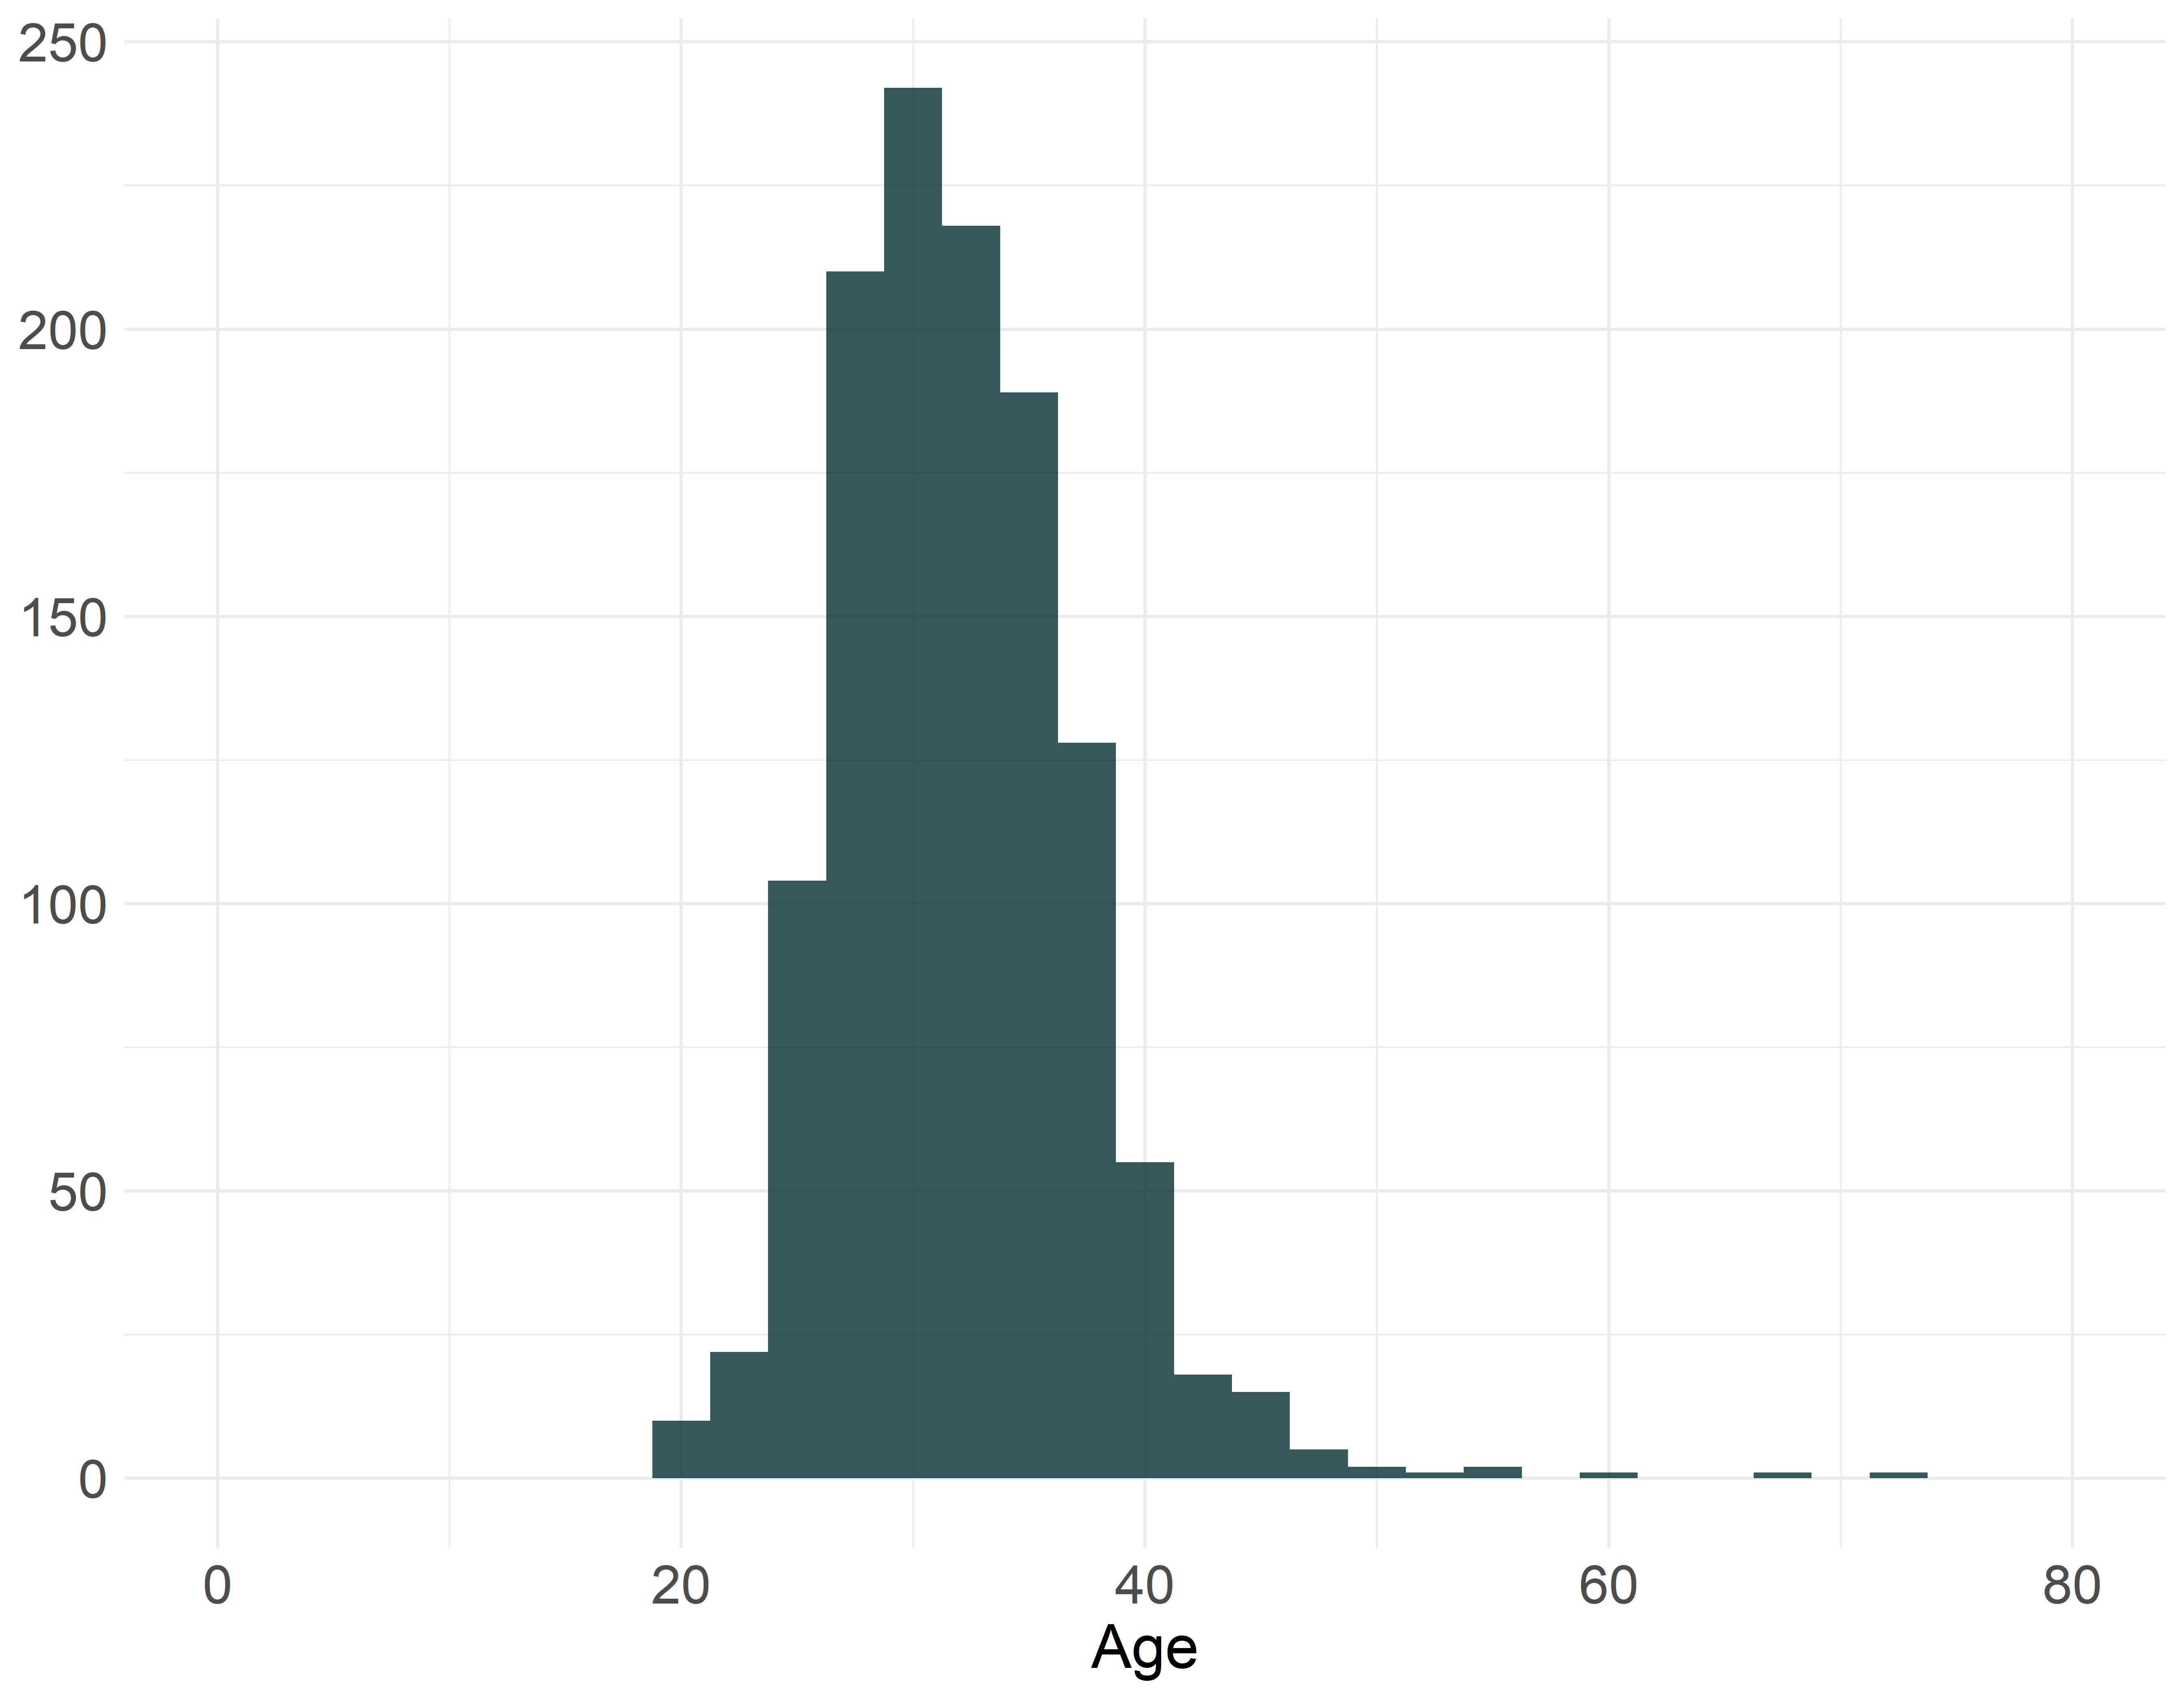
Age Distribution of Respondents
Respondent Distribution by Zip Code
Respondents by Number of Children Age 6 or Younger
Categories
Starred questions are considered “core” insights.
Benefits and benefits delivery
CPAL.JOB.015
Are you receiving any sort of public or employment benefits, such as Supplemental Nutrition Assistance Program (SNAP), Temporary Assistance for Needy Families (TANF), Social Security Income (SSI) or others?
Rate of response: 99.7%
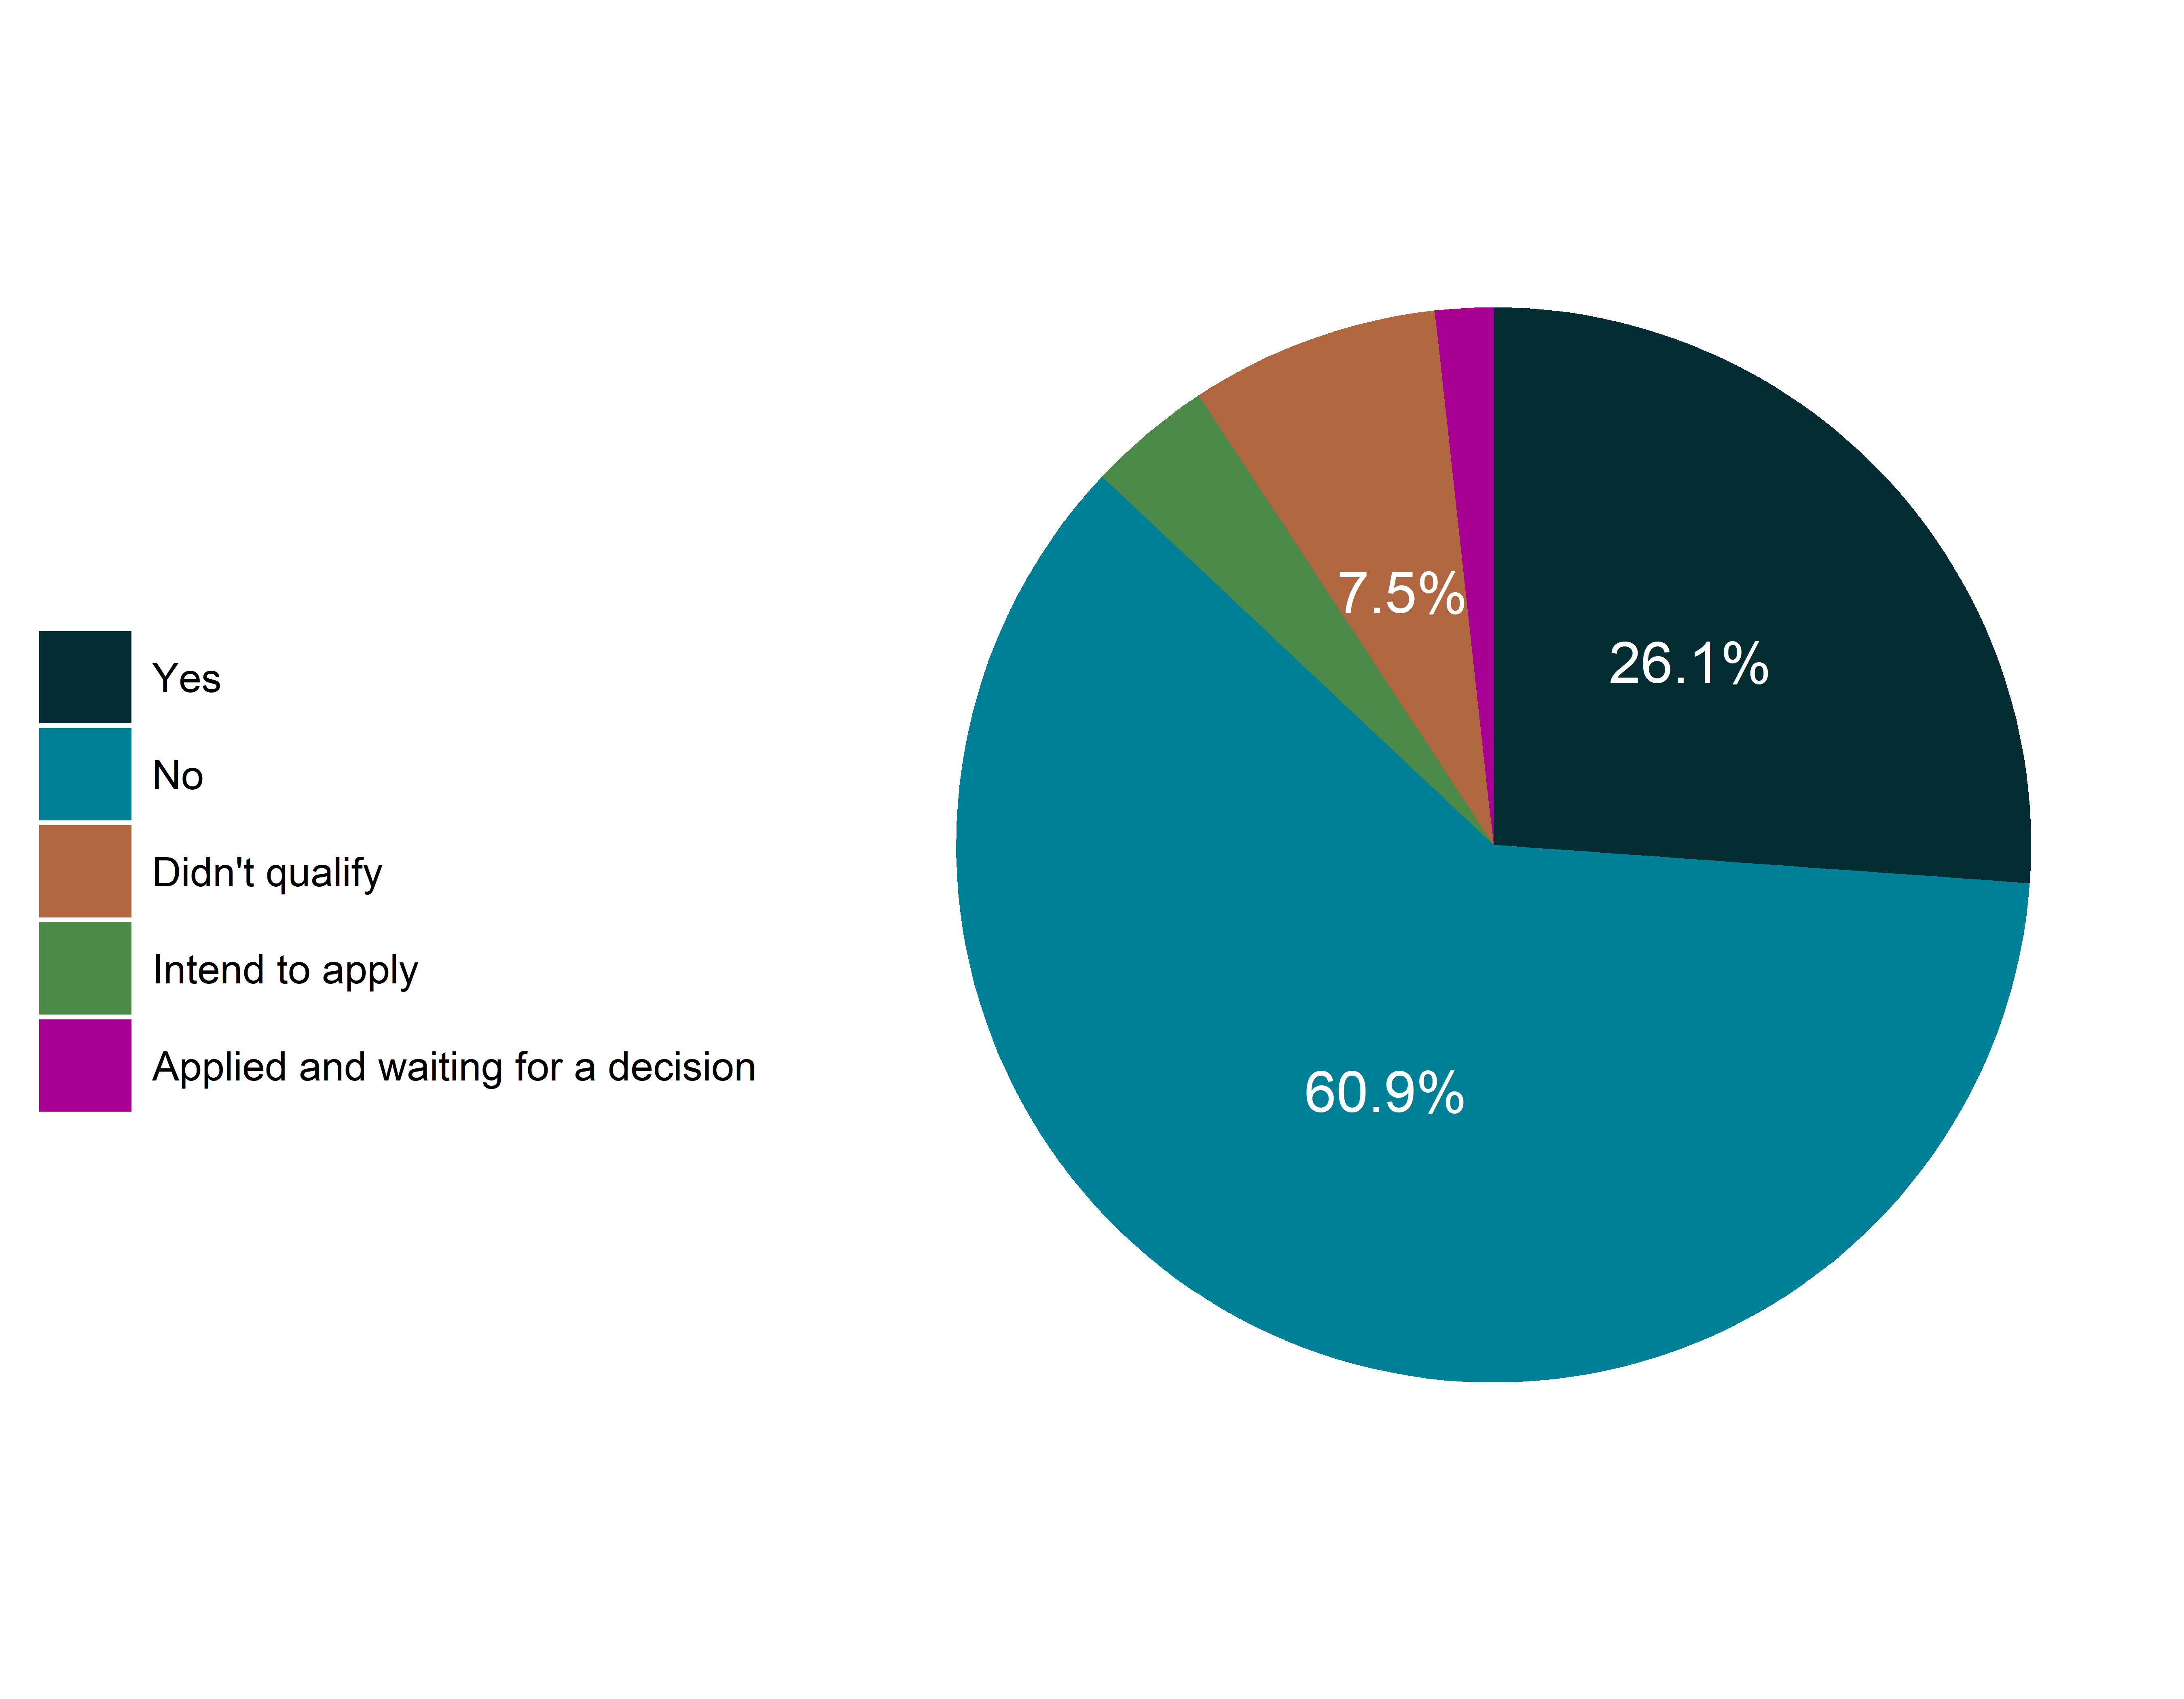
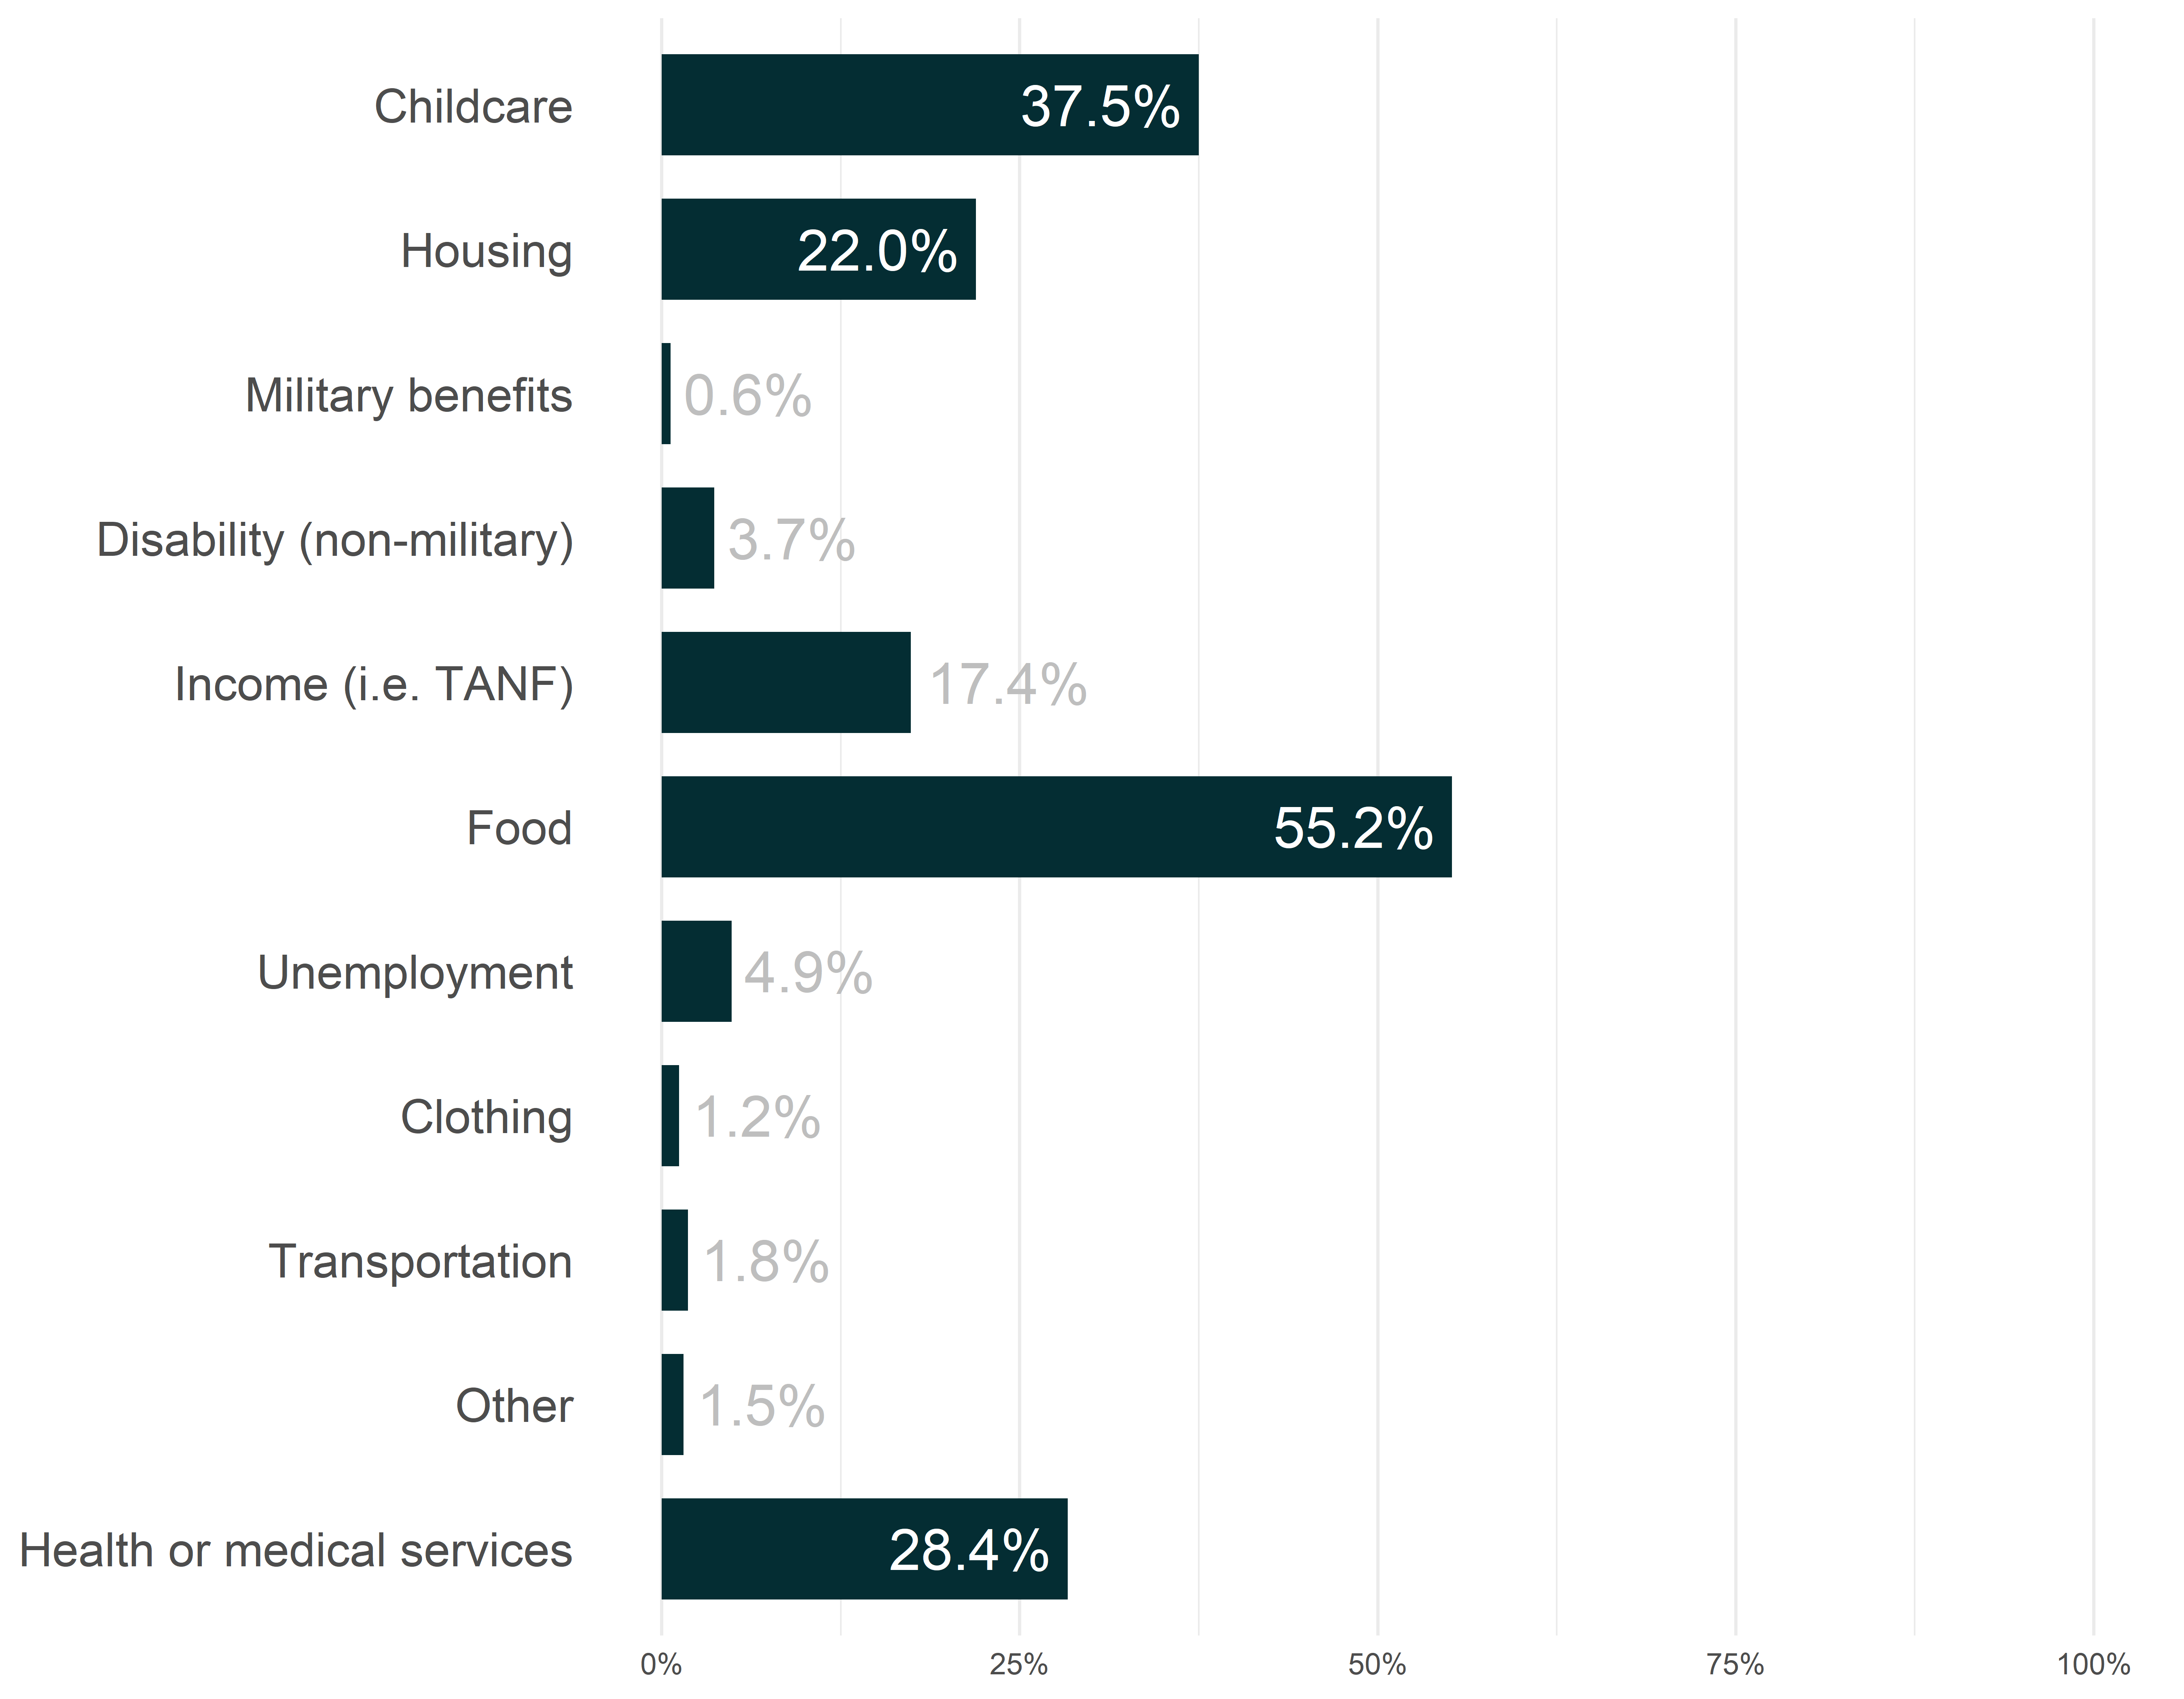
Percent of those receiving benefits who receive benefits for…
CPAL.BEN.001.b
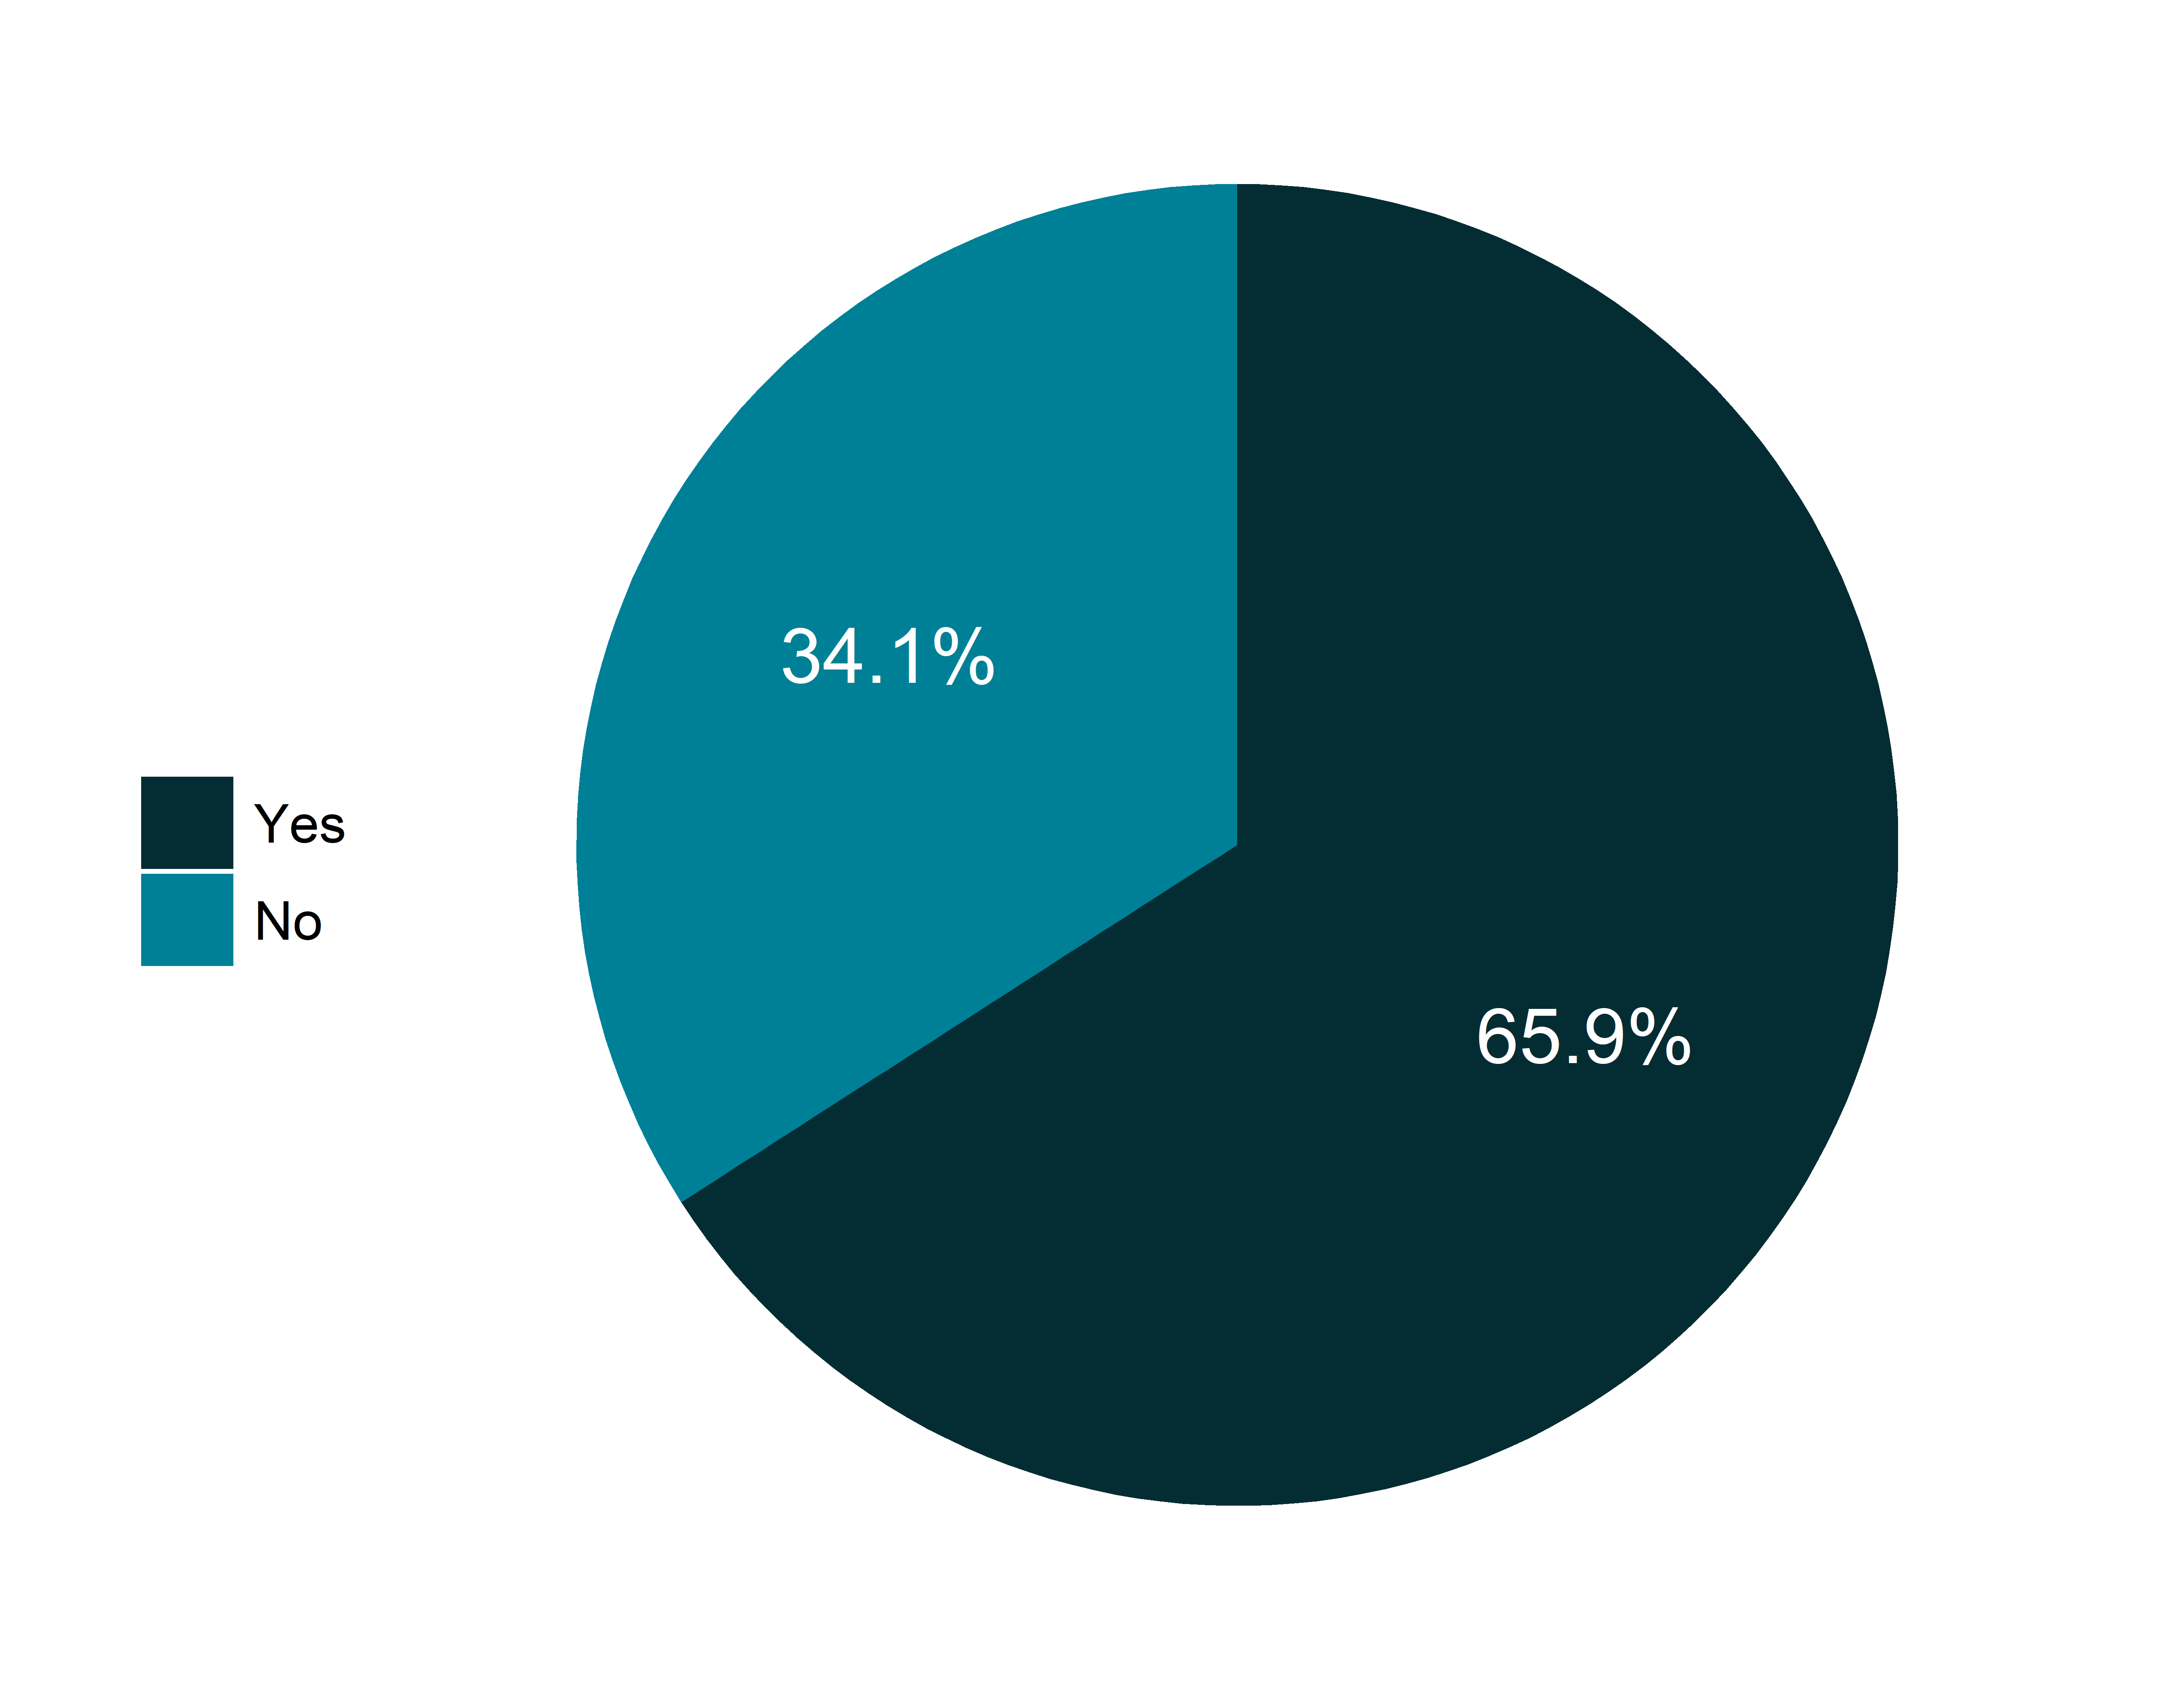
Do your food benefits make it possible to buy enough groceries each month?
Rate of response (all respondents): 7.0%
Rate of response (receives food benefits): 100.0%
CPAL.BEN.001
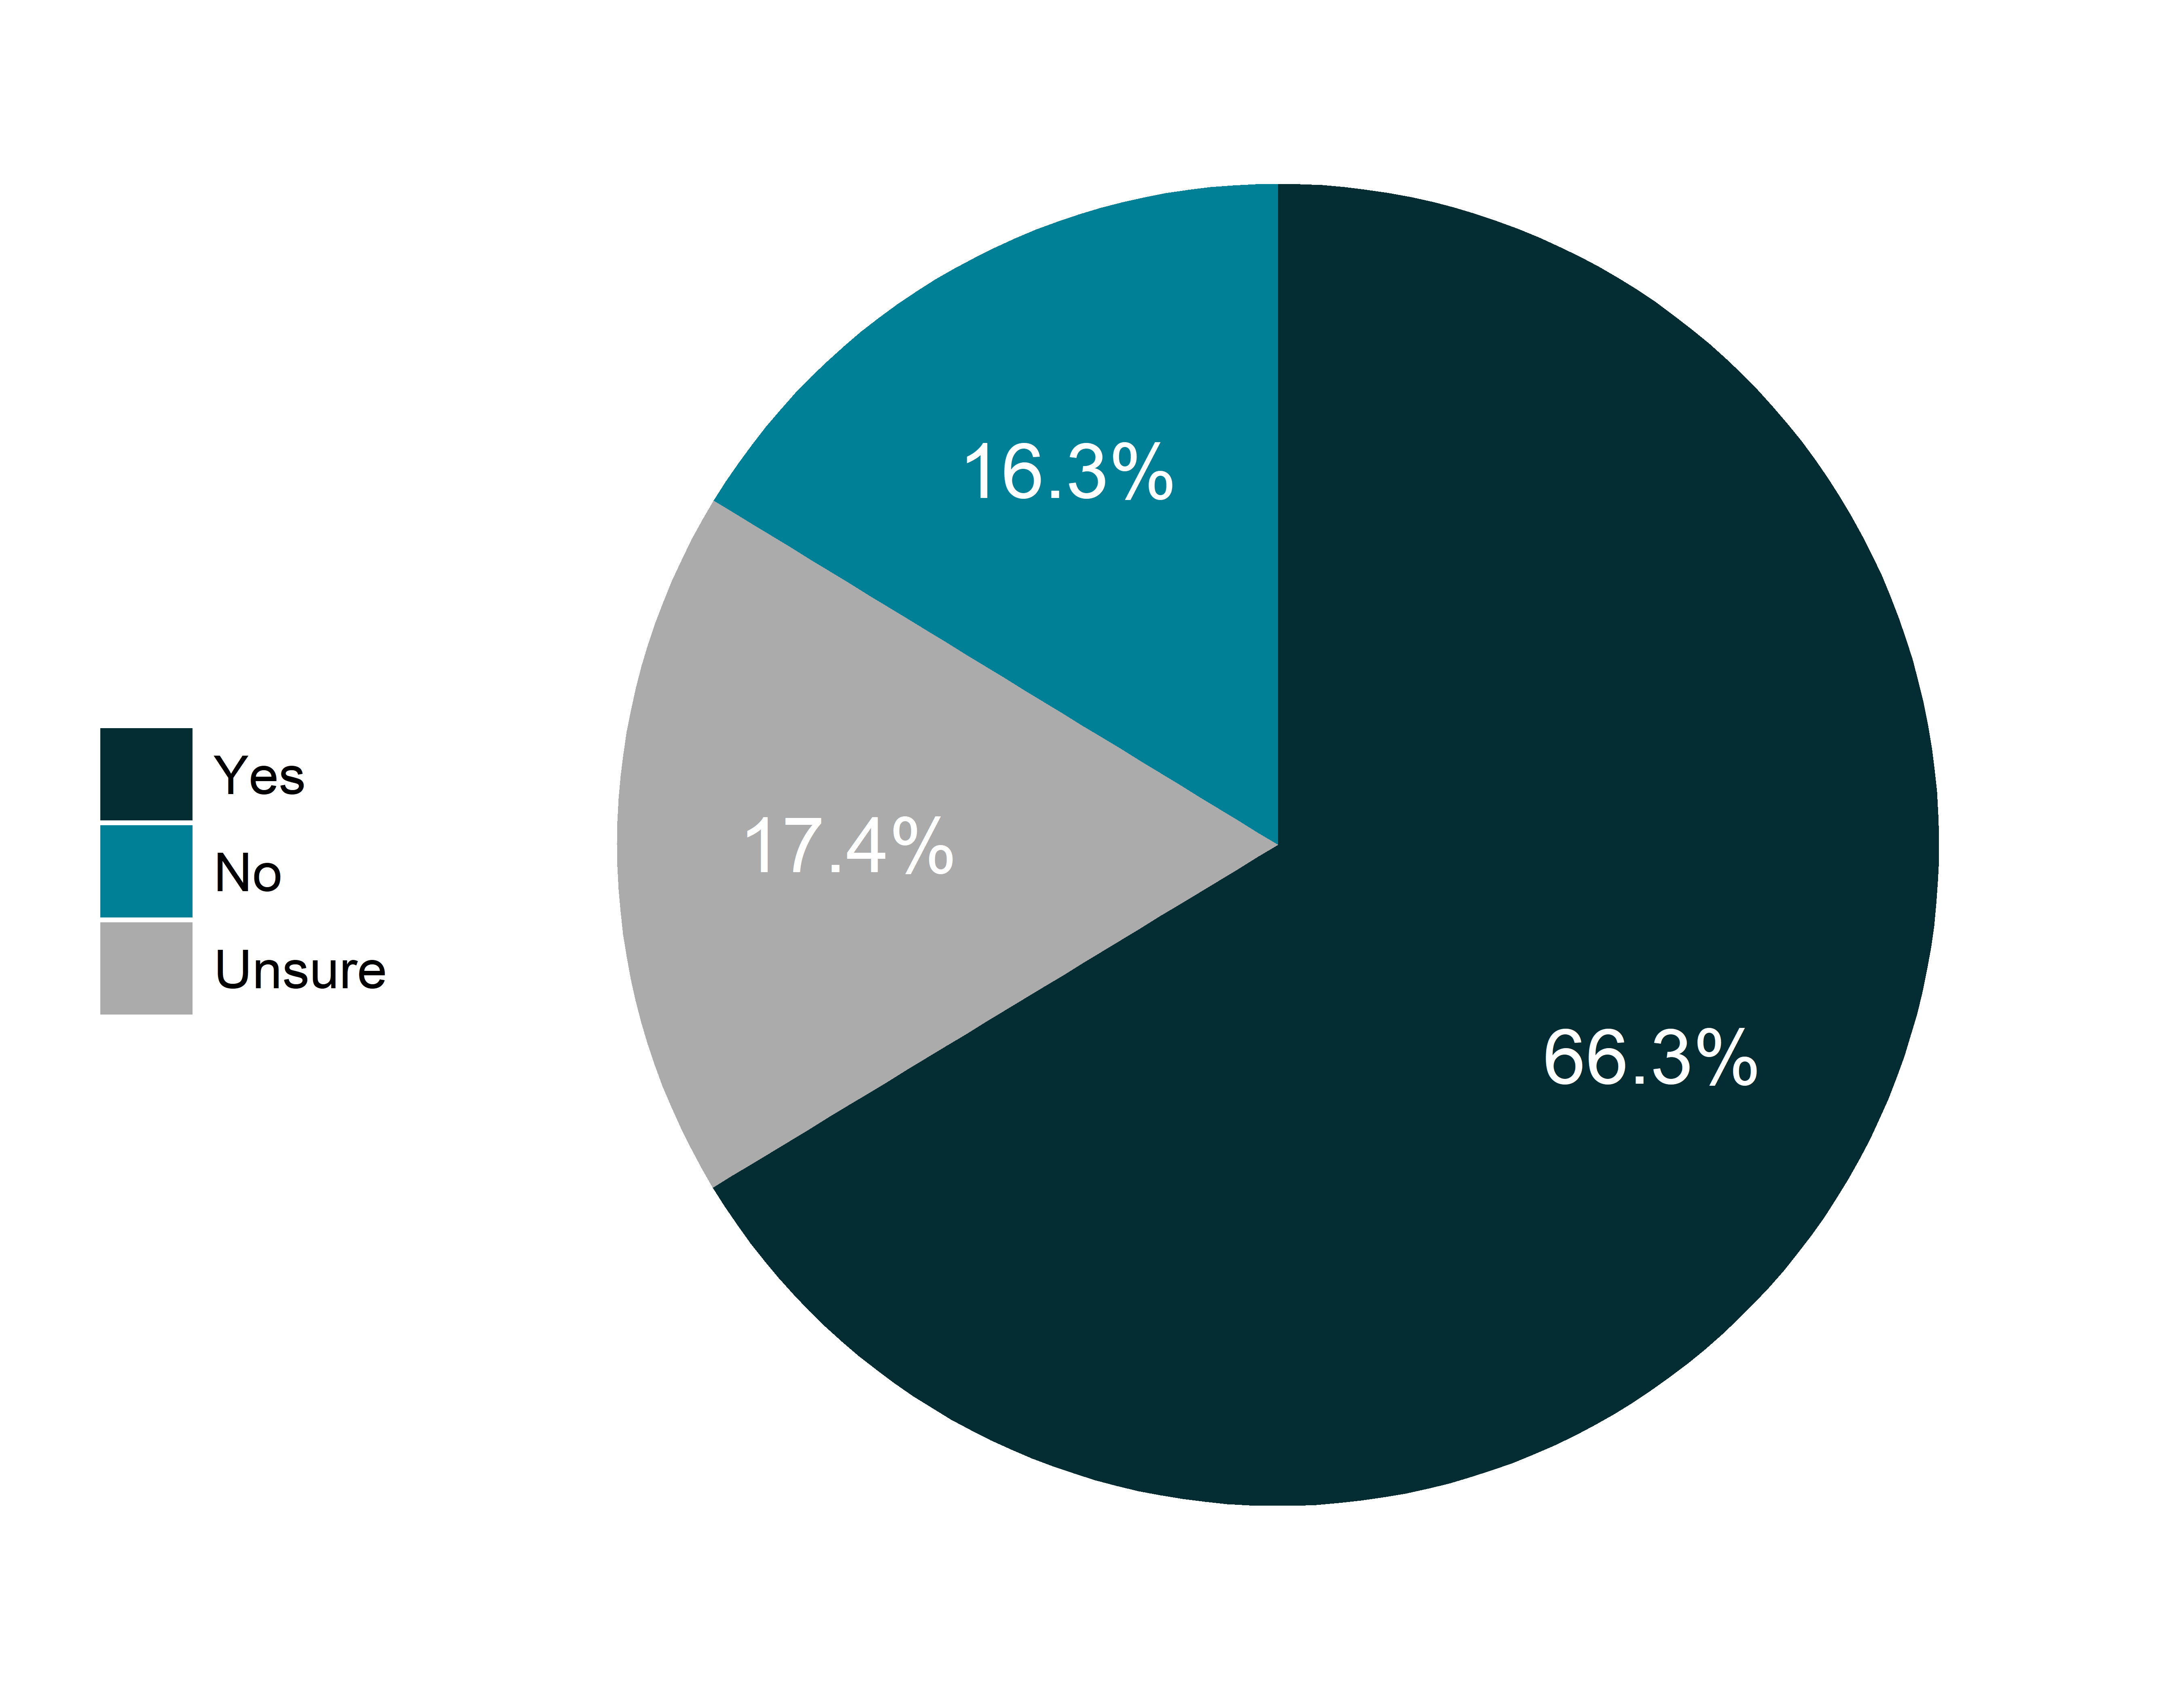
Have you tried to apply for a federal or local benefit in the last year, such as SNAP, WIC, Medicaid, or rental assistance?
Rate of response: 99.7%
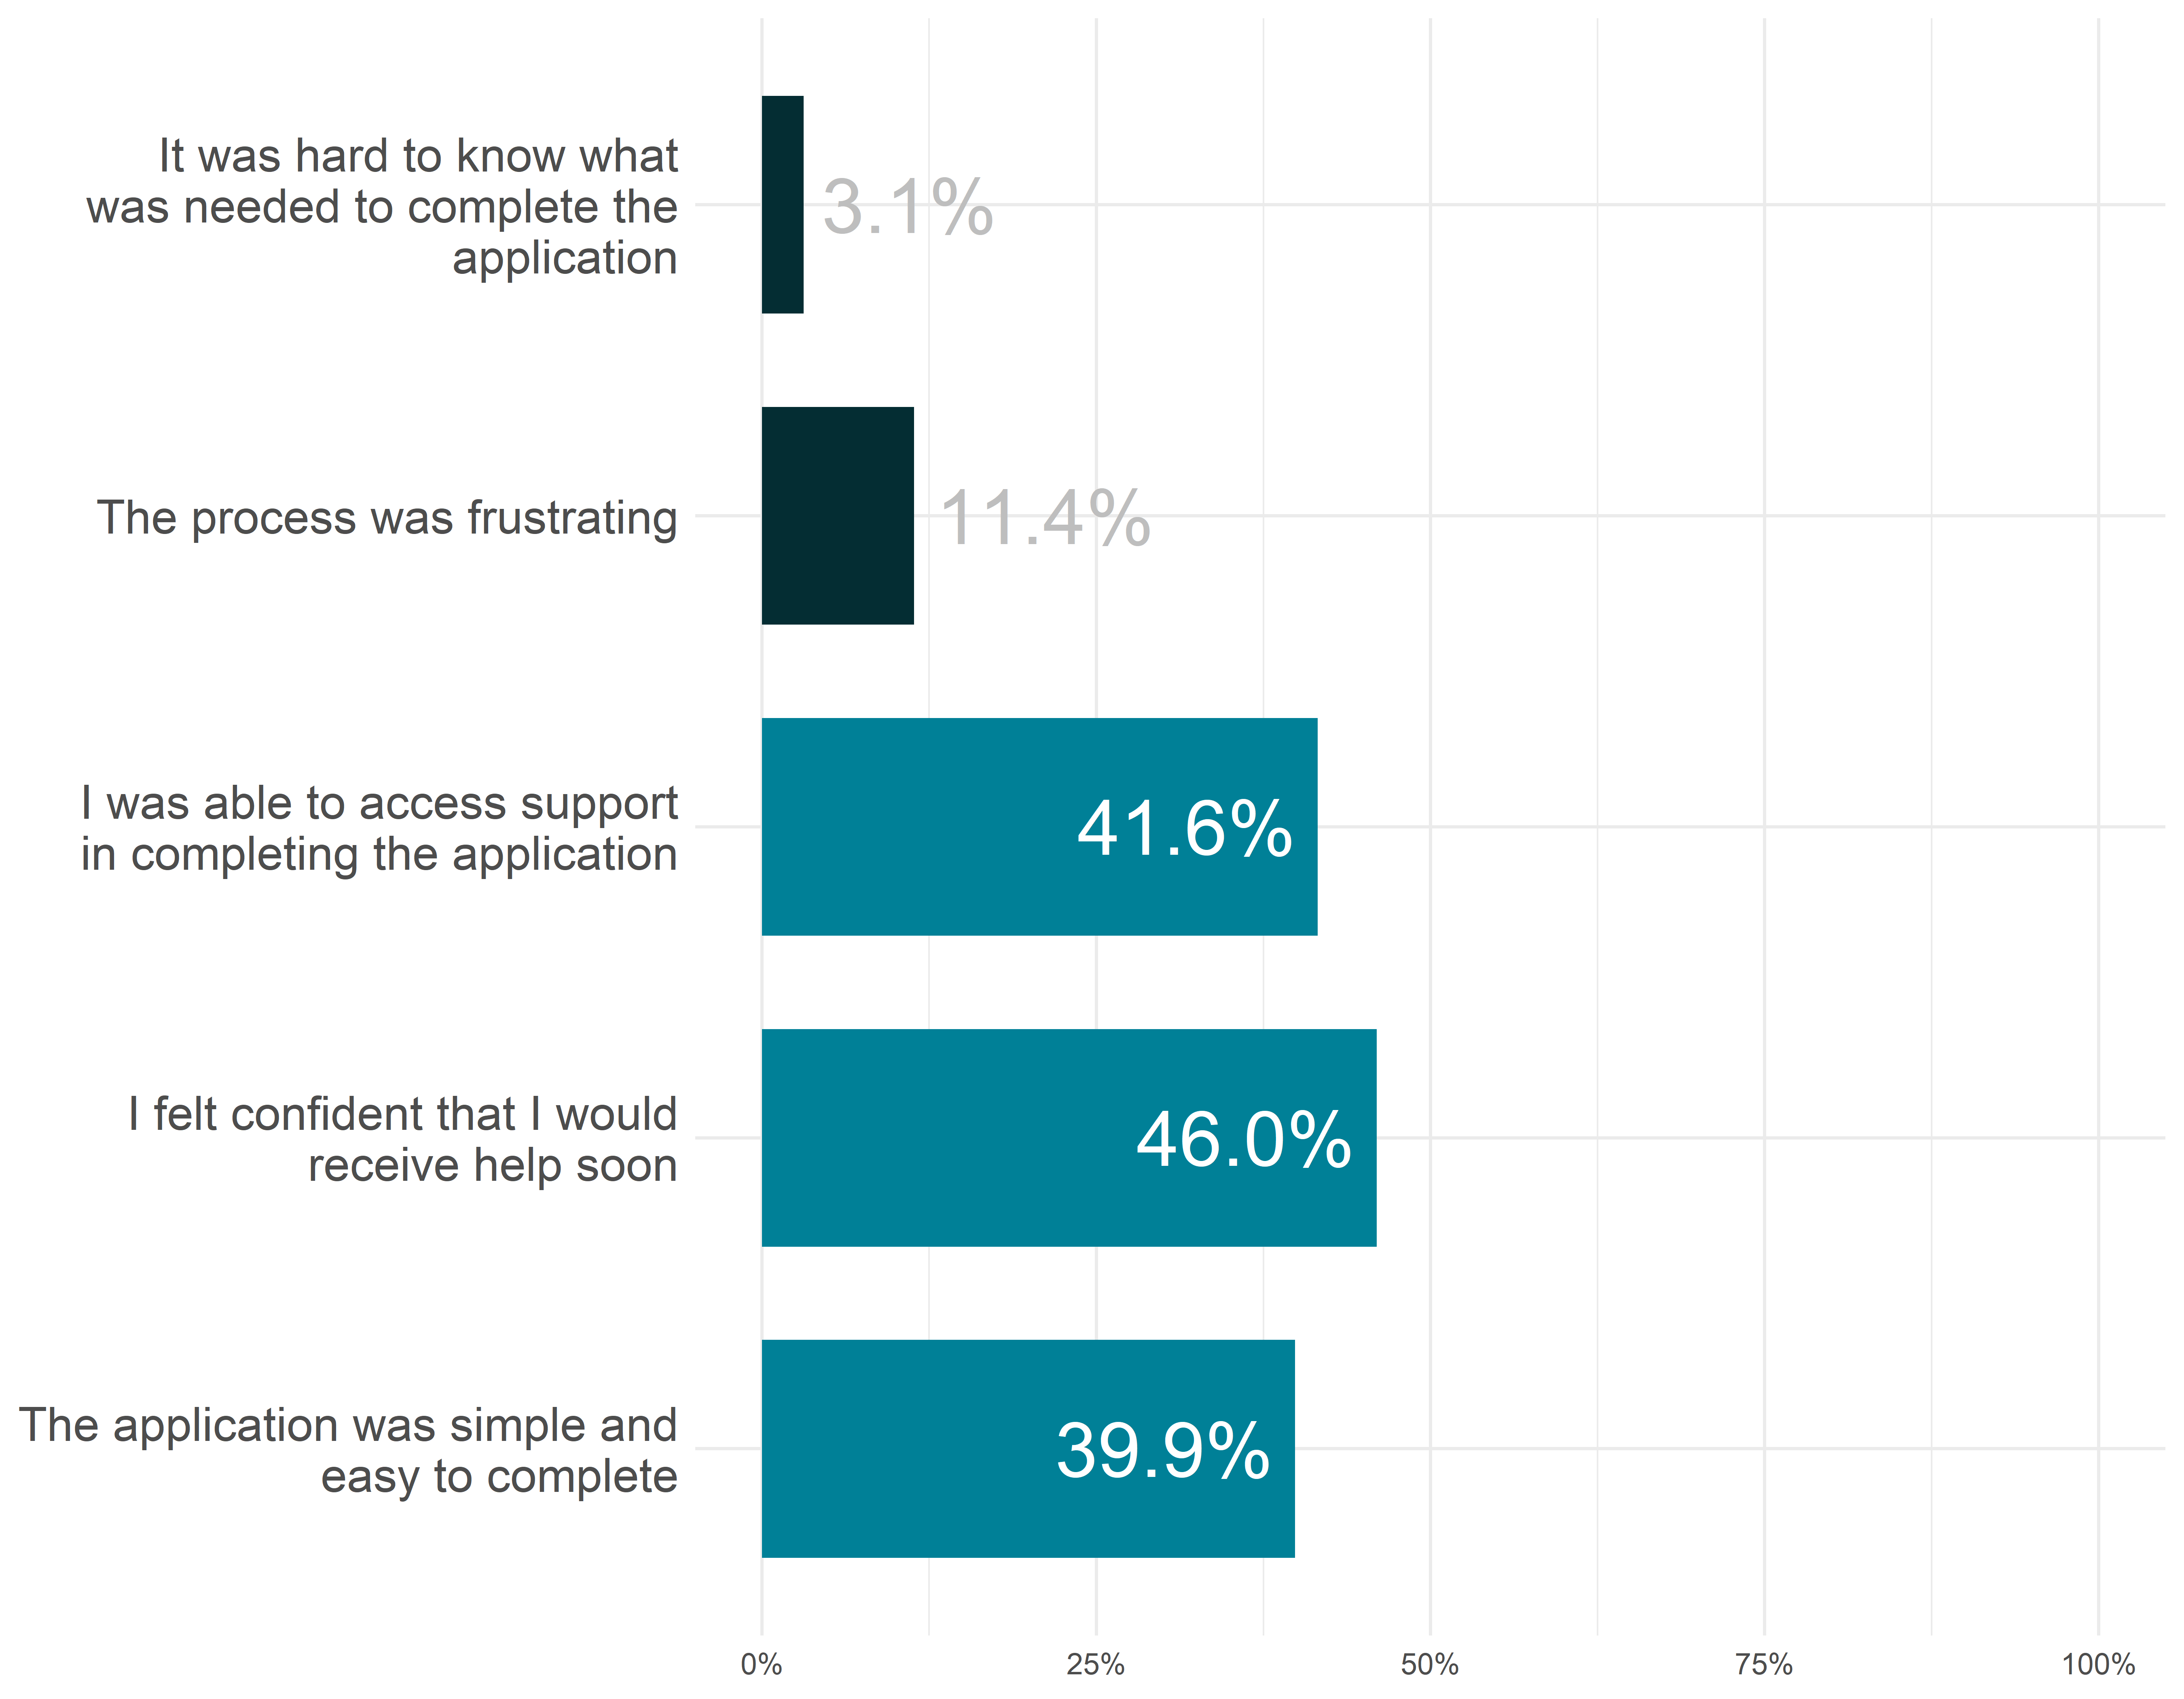
Percent of those applying for benefits who found that…
Employment and income
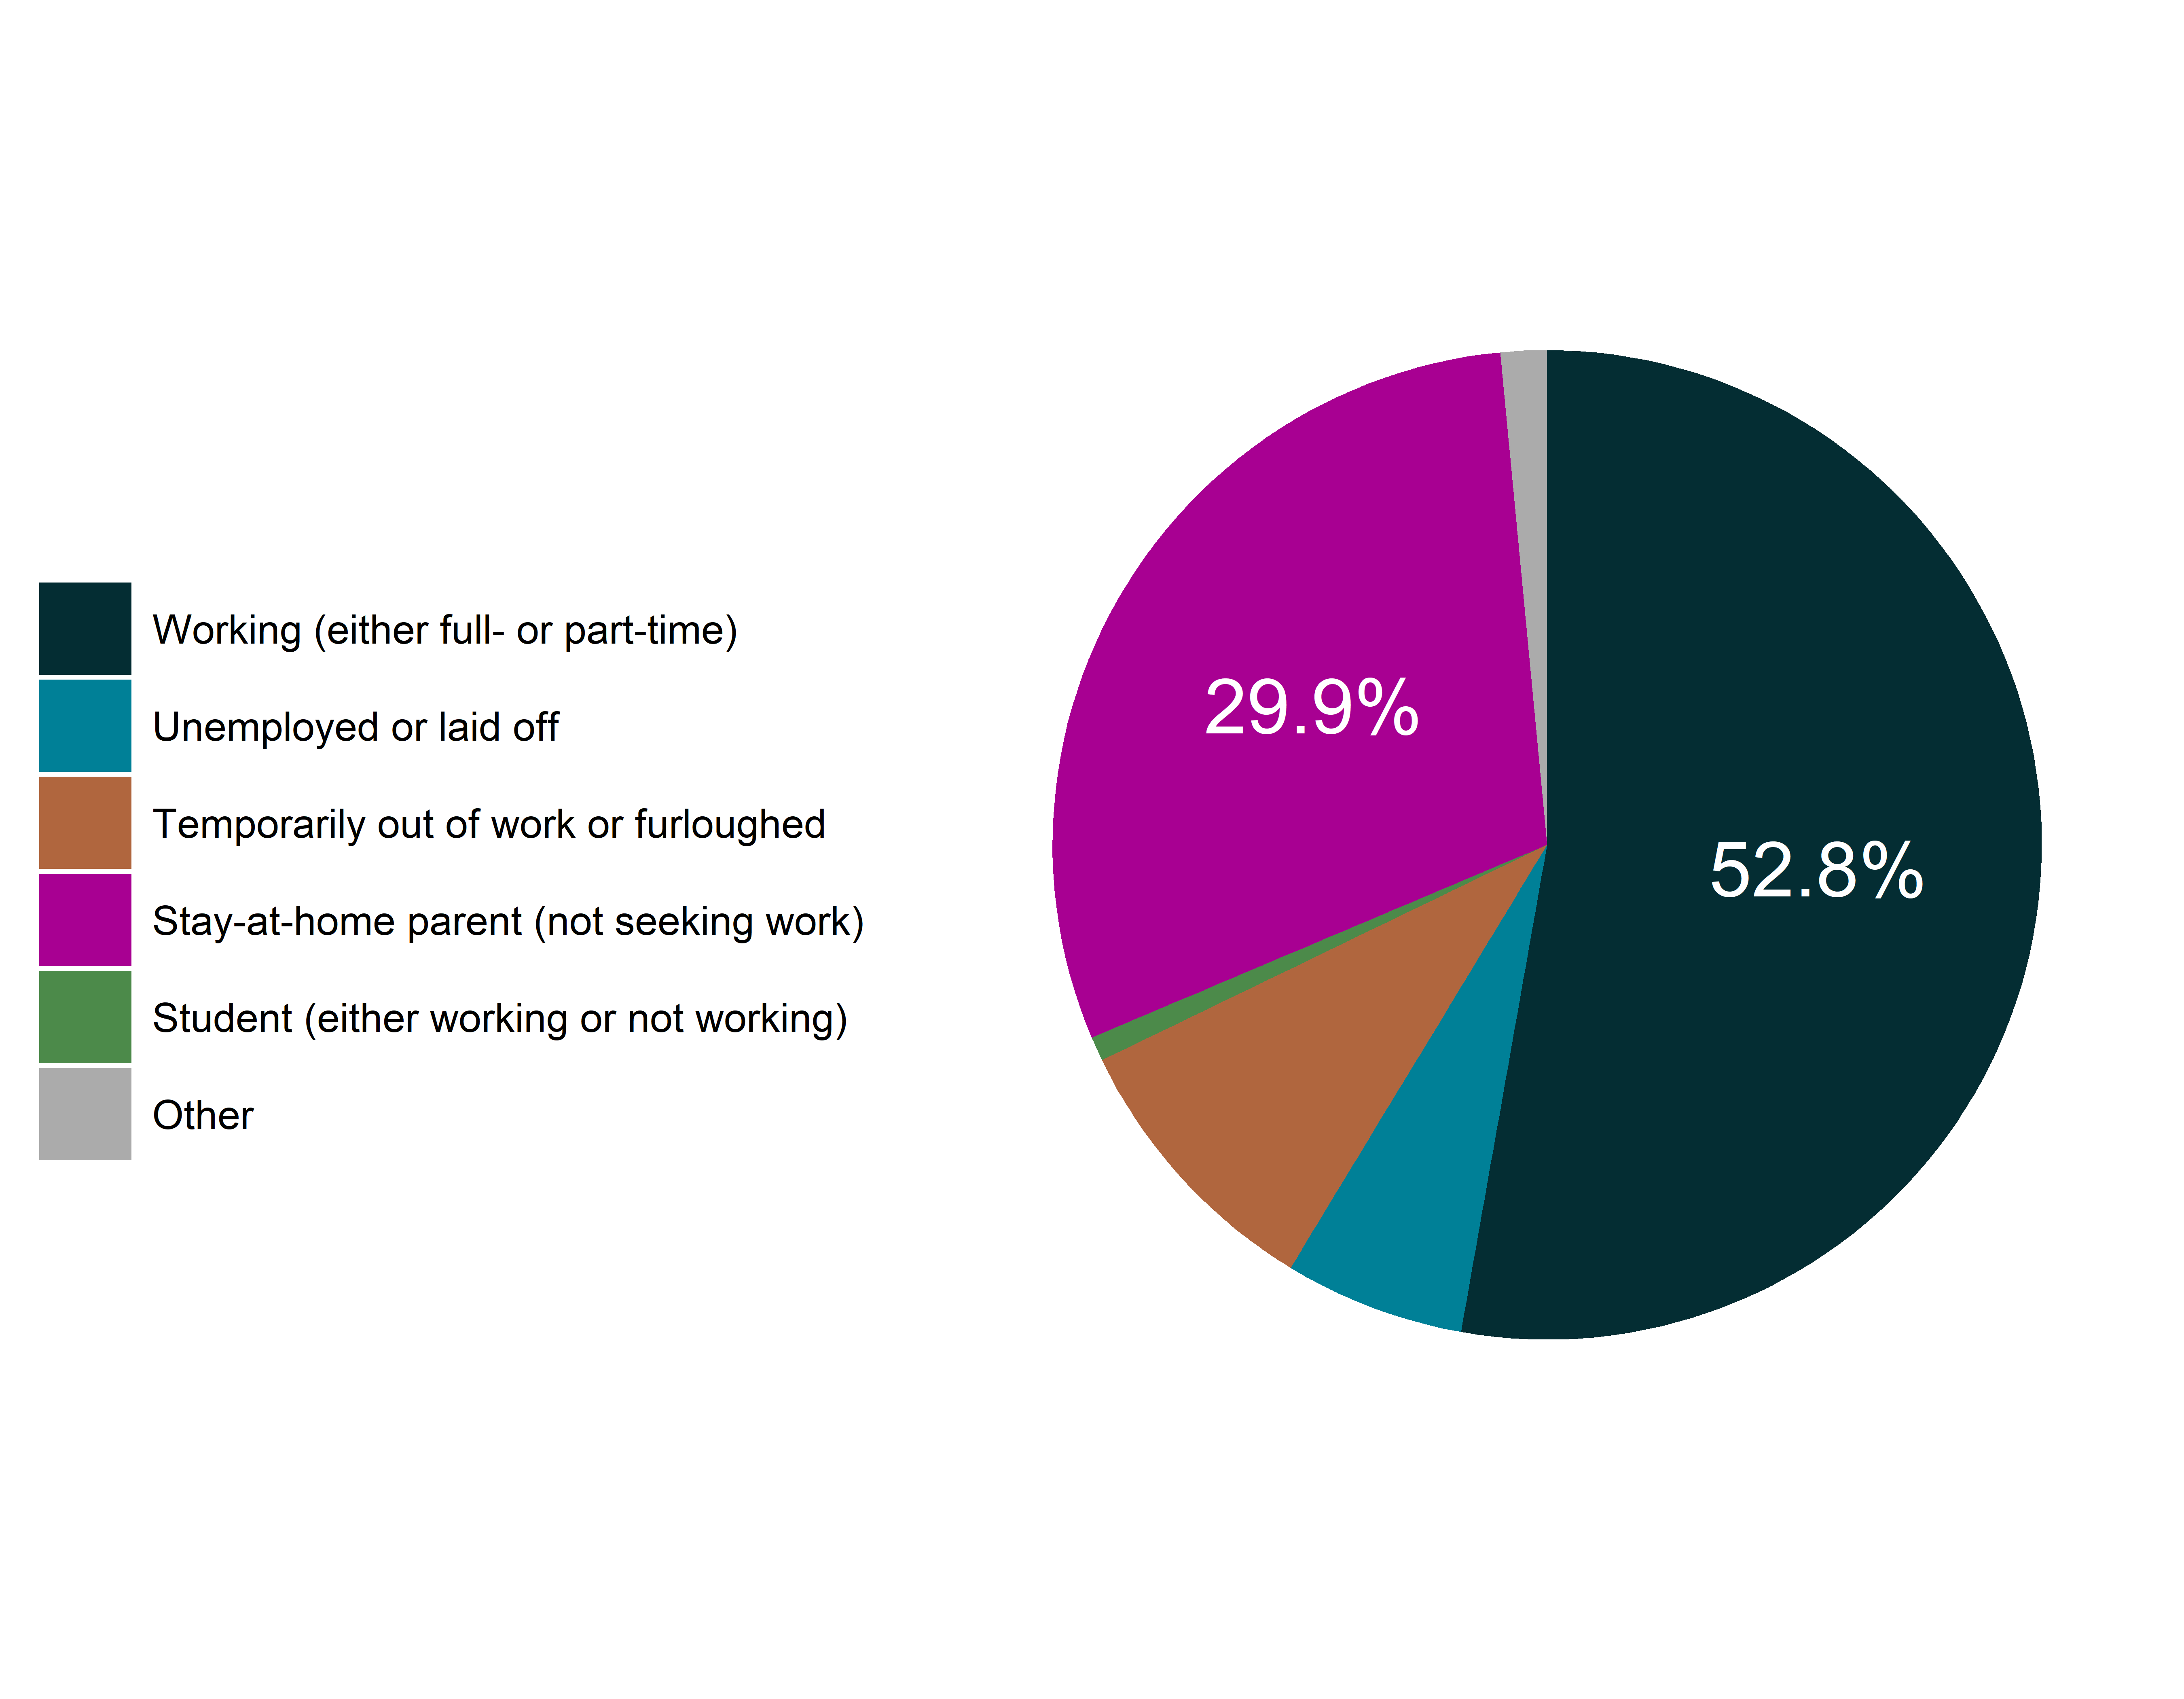
CPAL.JOB.008
Current employment status
Rate of response: 99.8%
Annual2023Income
Reported income from last year
Rate of Response: 100
Median Income: $55,000
Maximum Income: $1,320,000
The Dallas County median income in 2021 was $65,011, so this survey sample is lower-income than Dallas County as a whole.
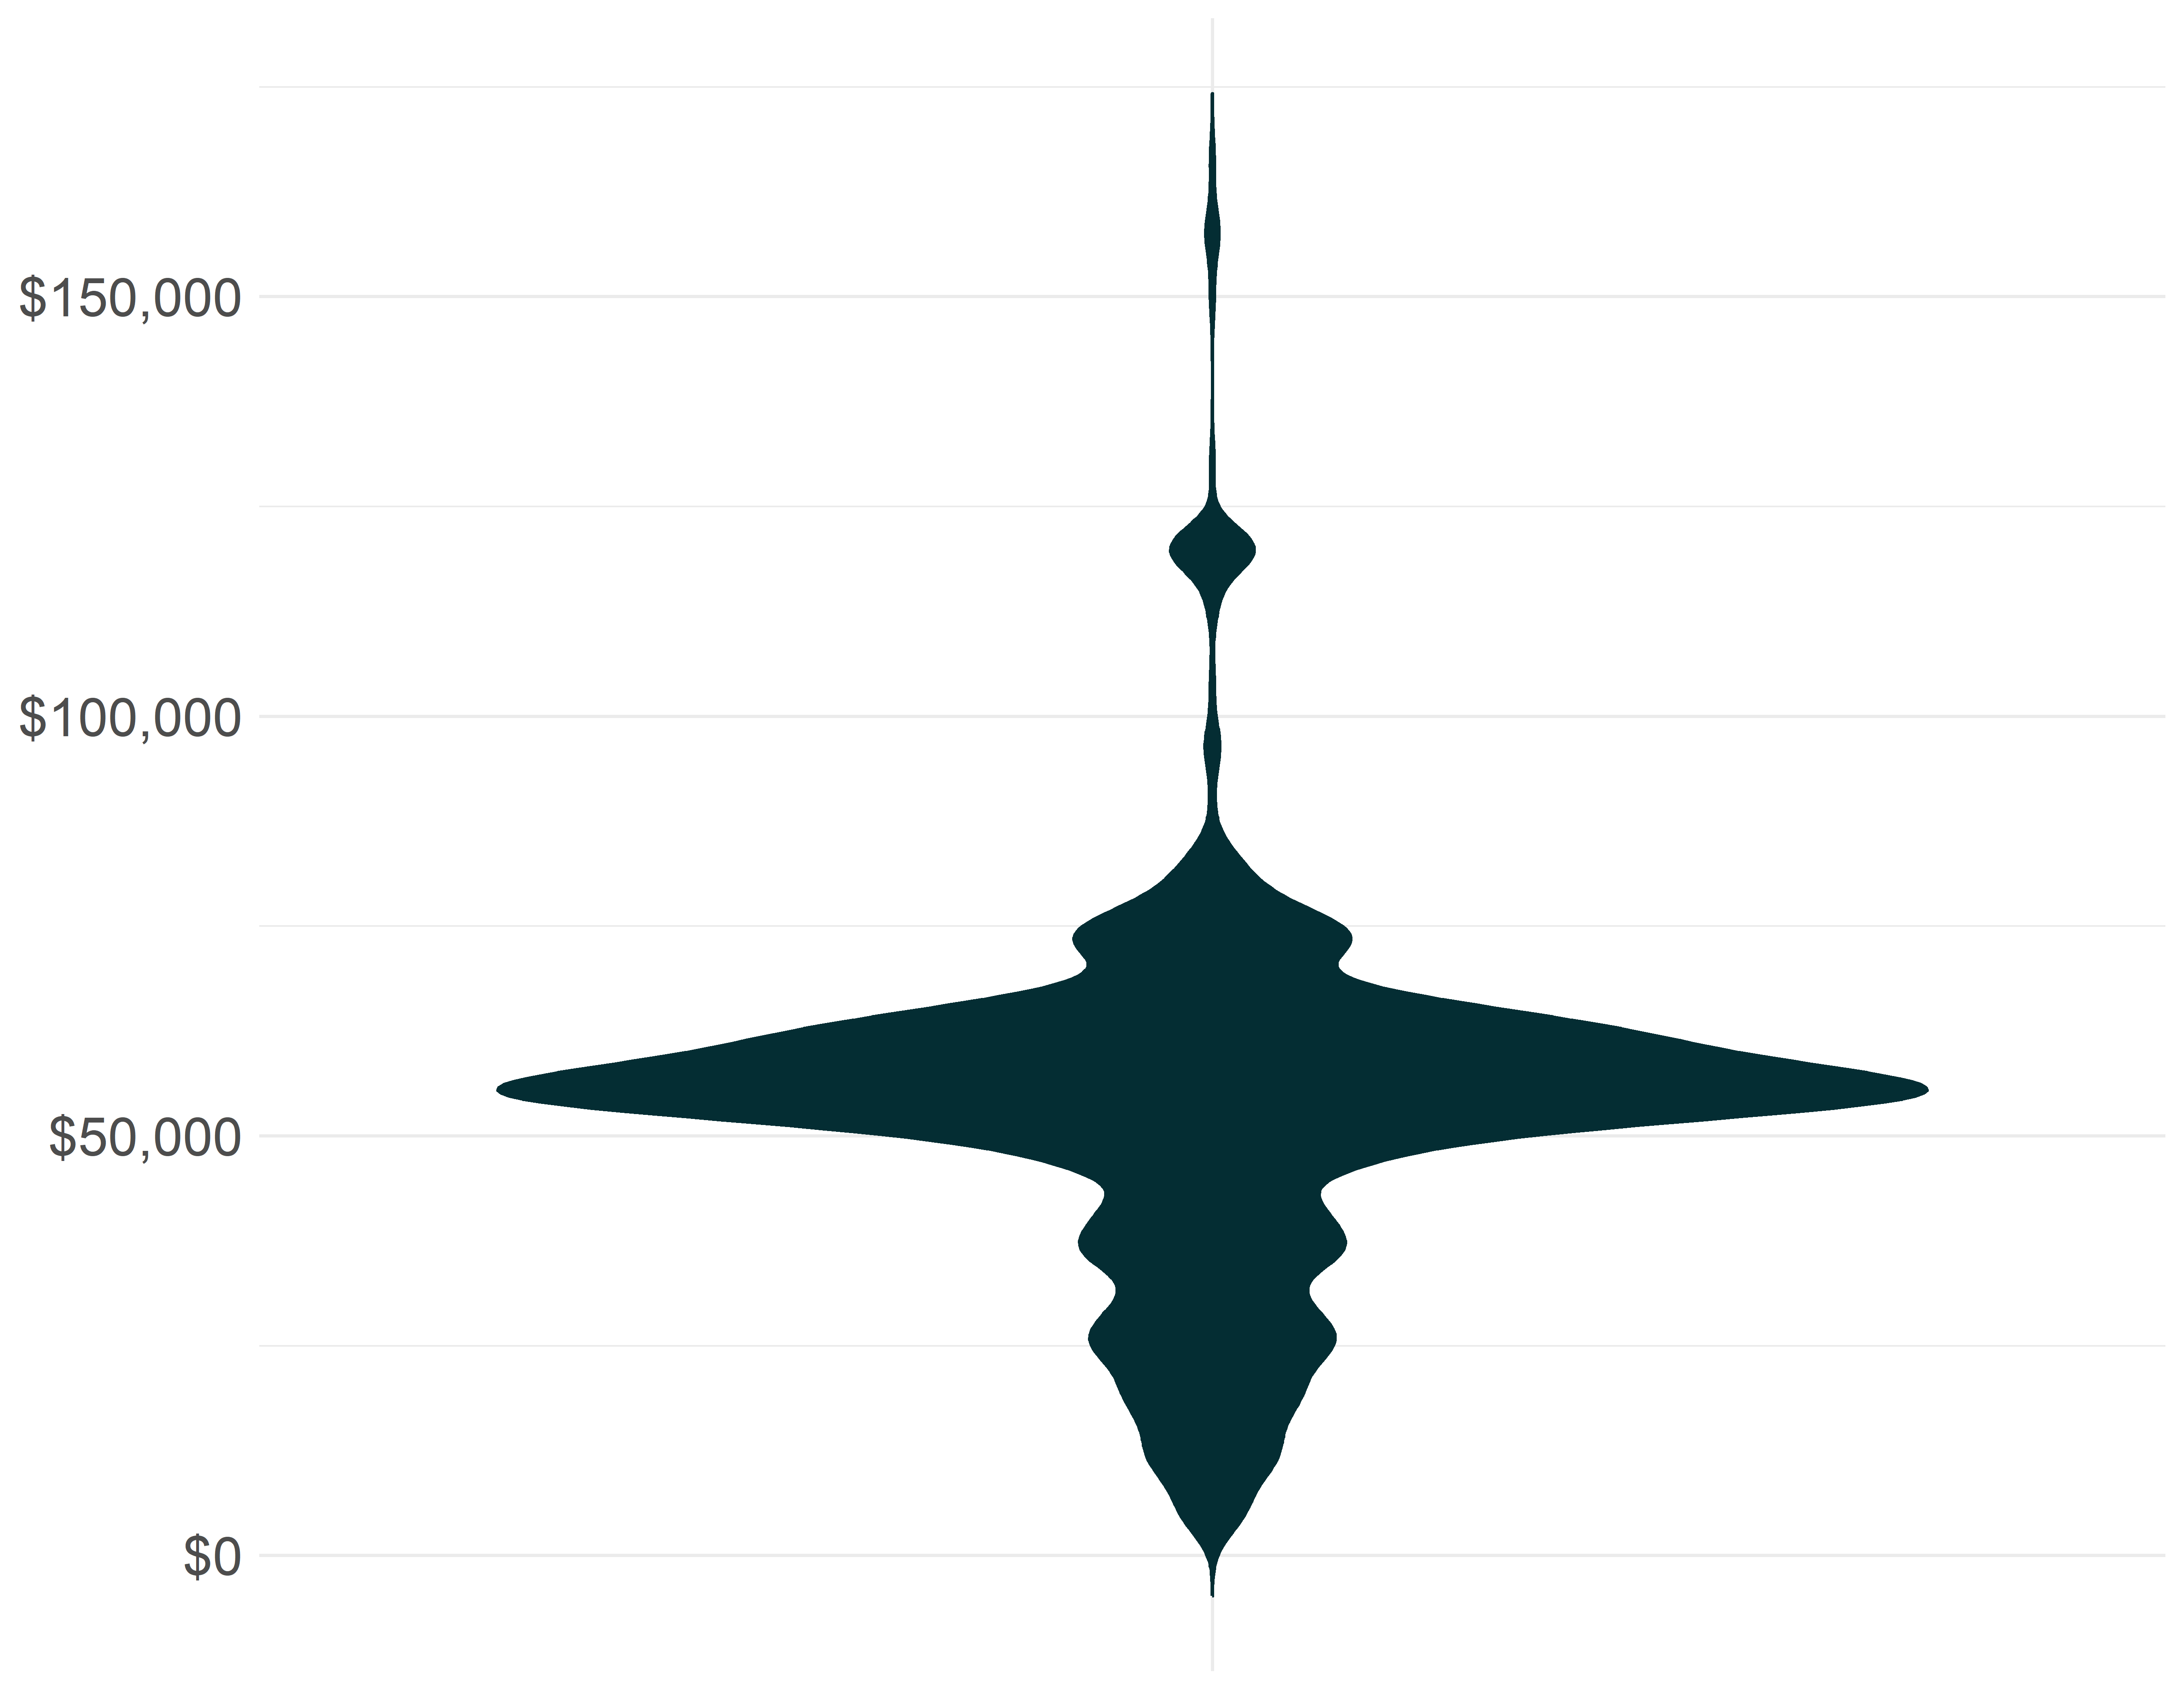
16 respondents reporting income above $200,000 not visualized. Maximum reported income is $1,320,000
POVERTYLine2023
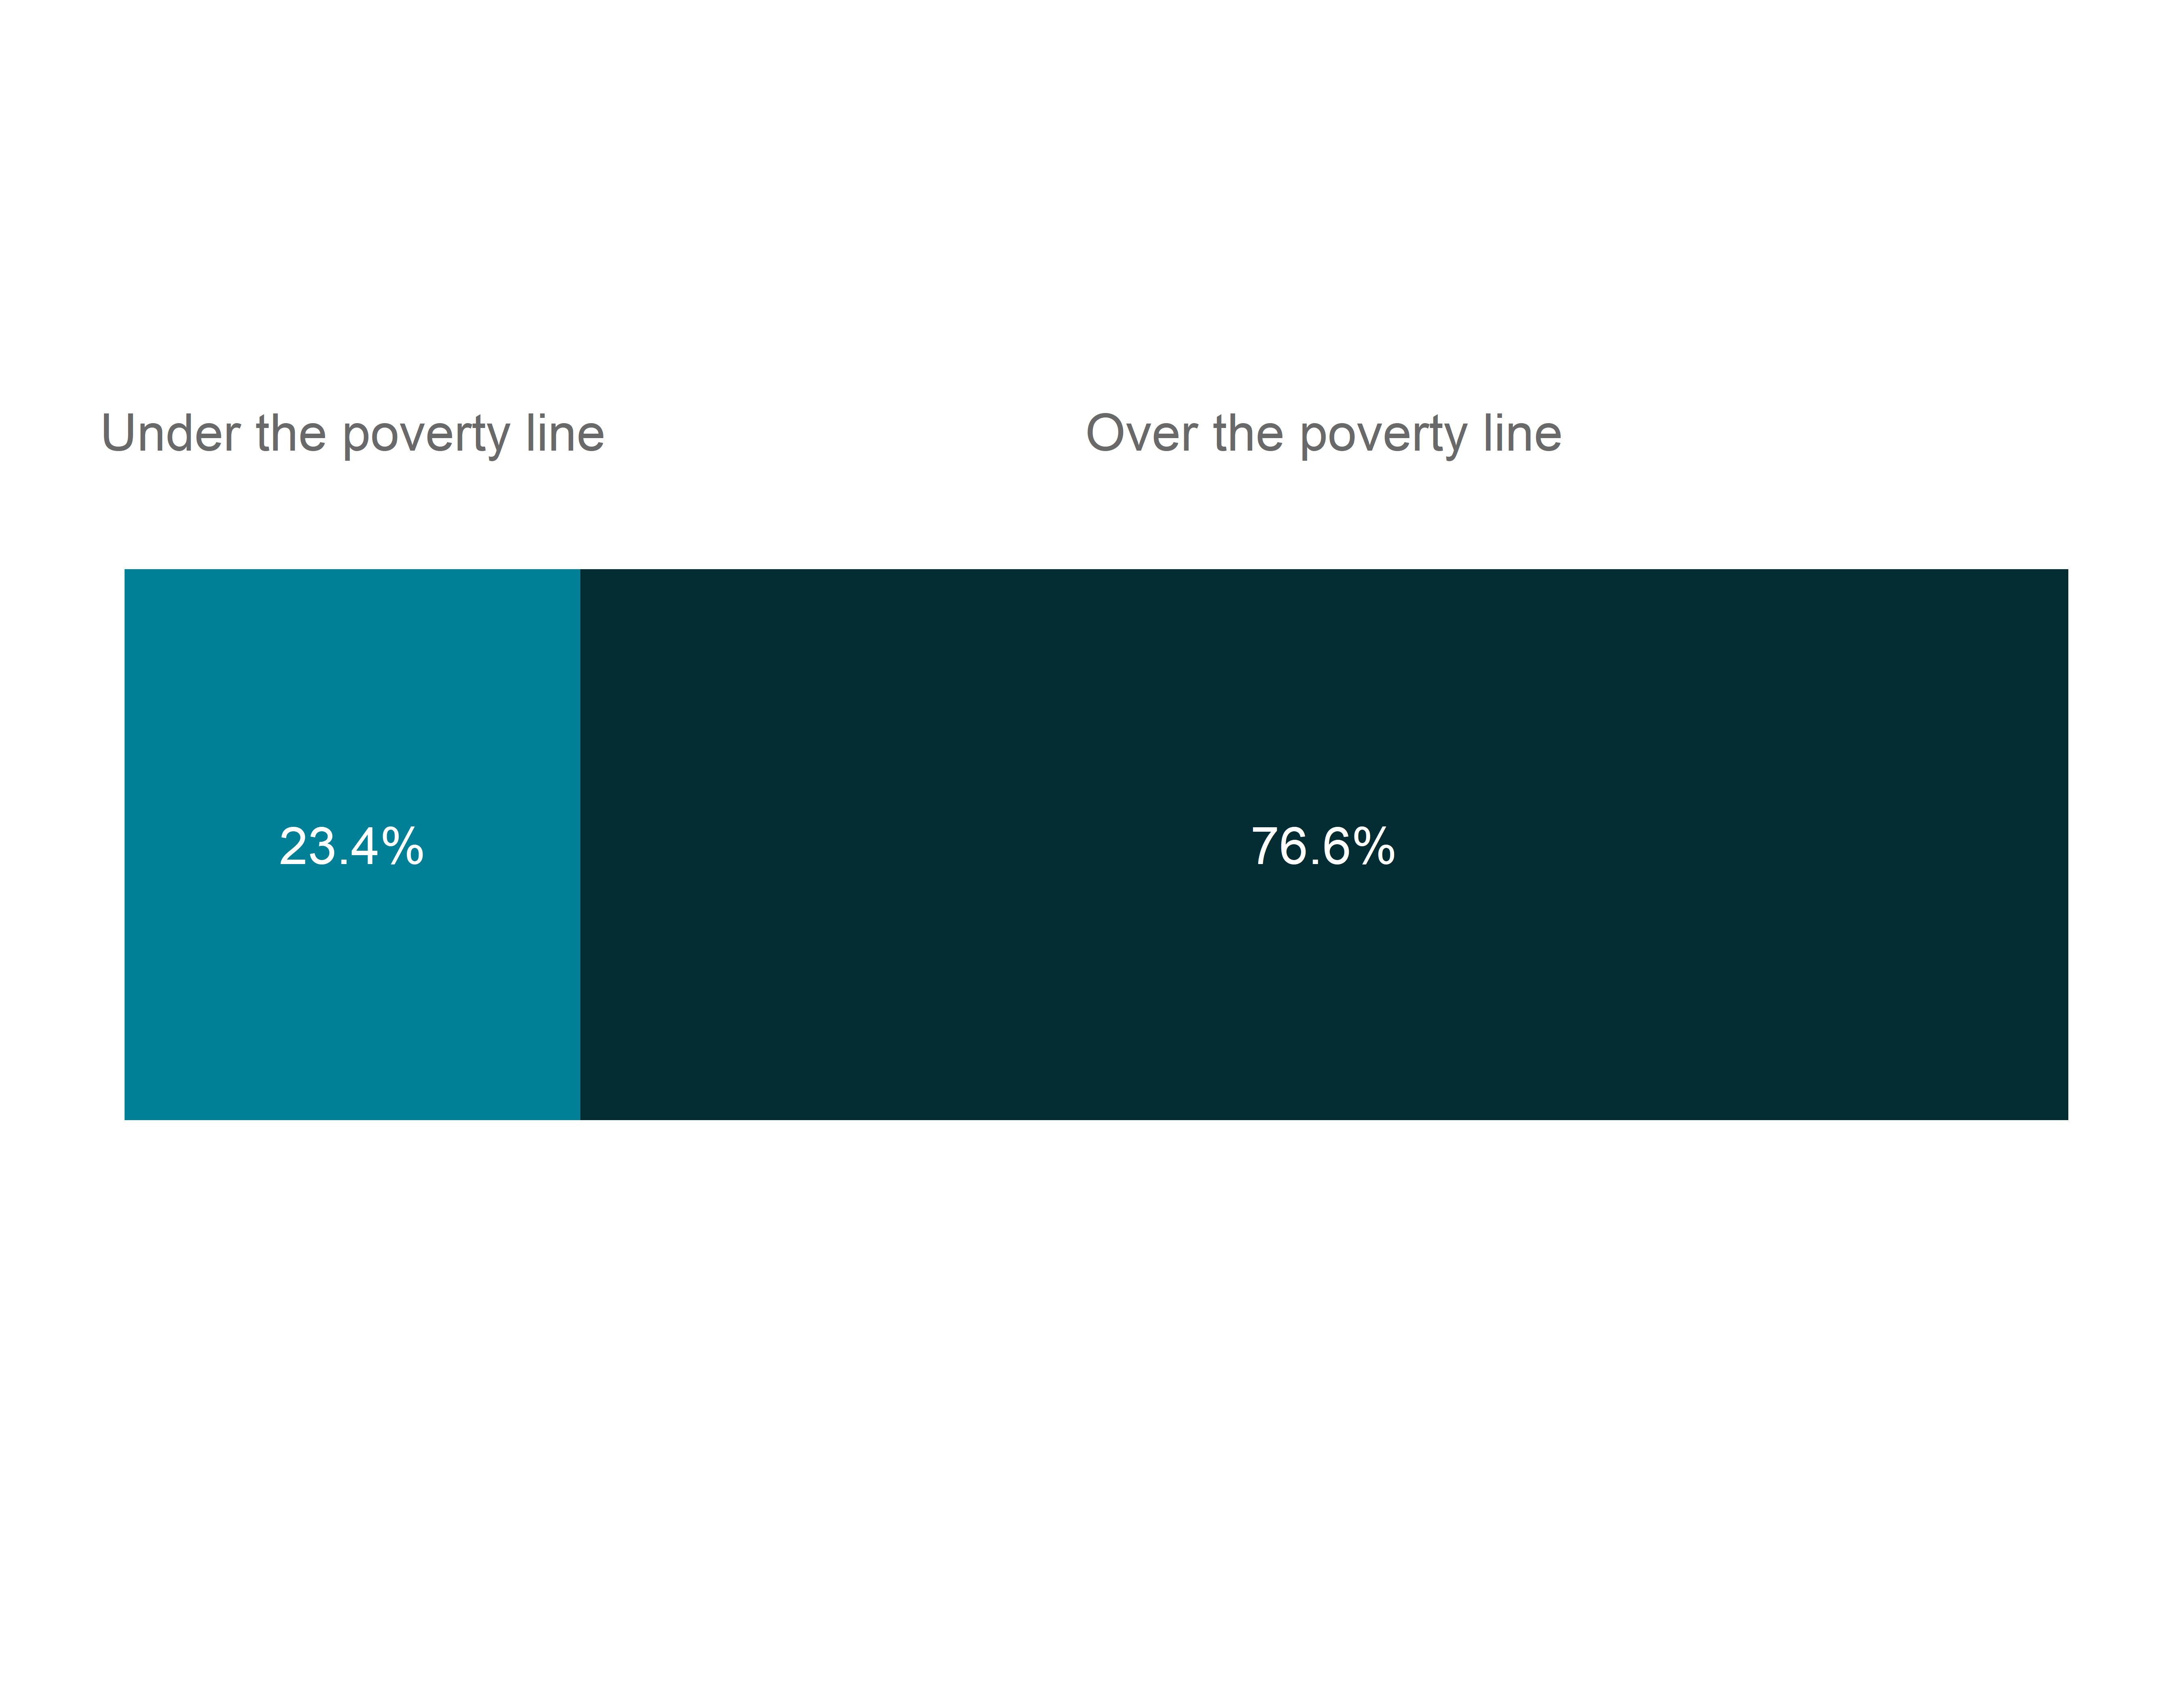
Above or below poverty line
Rate of response: 99.9%
The Dallas County poverty rate in 2021 was 14%, so this survey sample is lower-income than Dallas County as a whole.
CPAL.EHQ.001
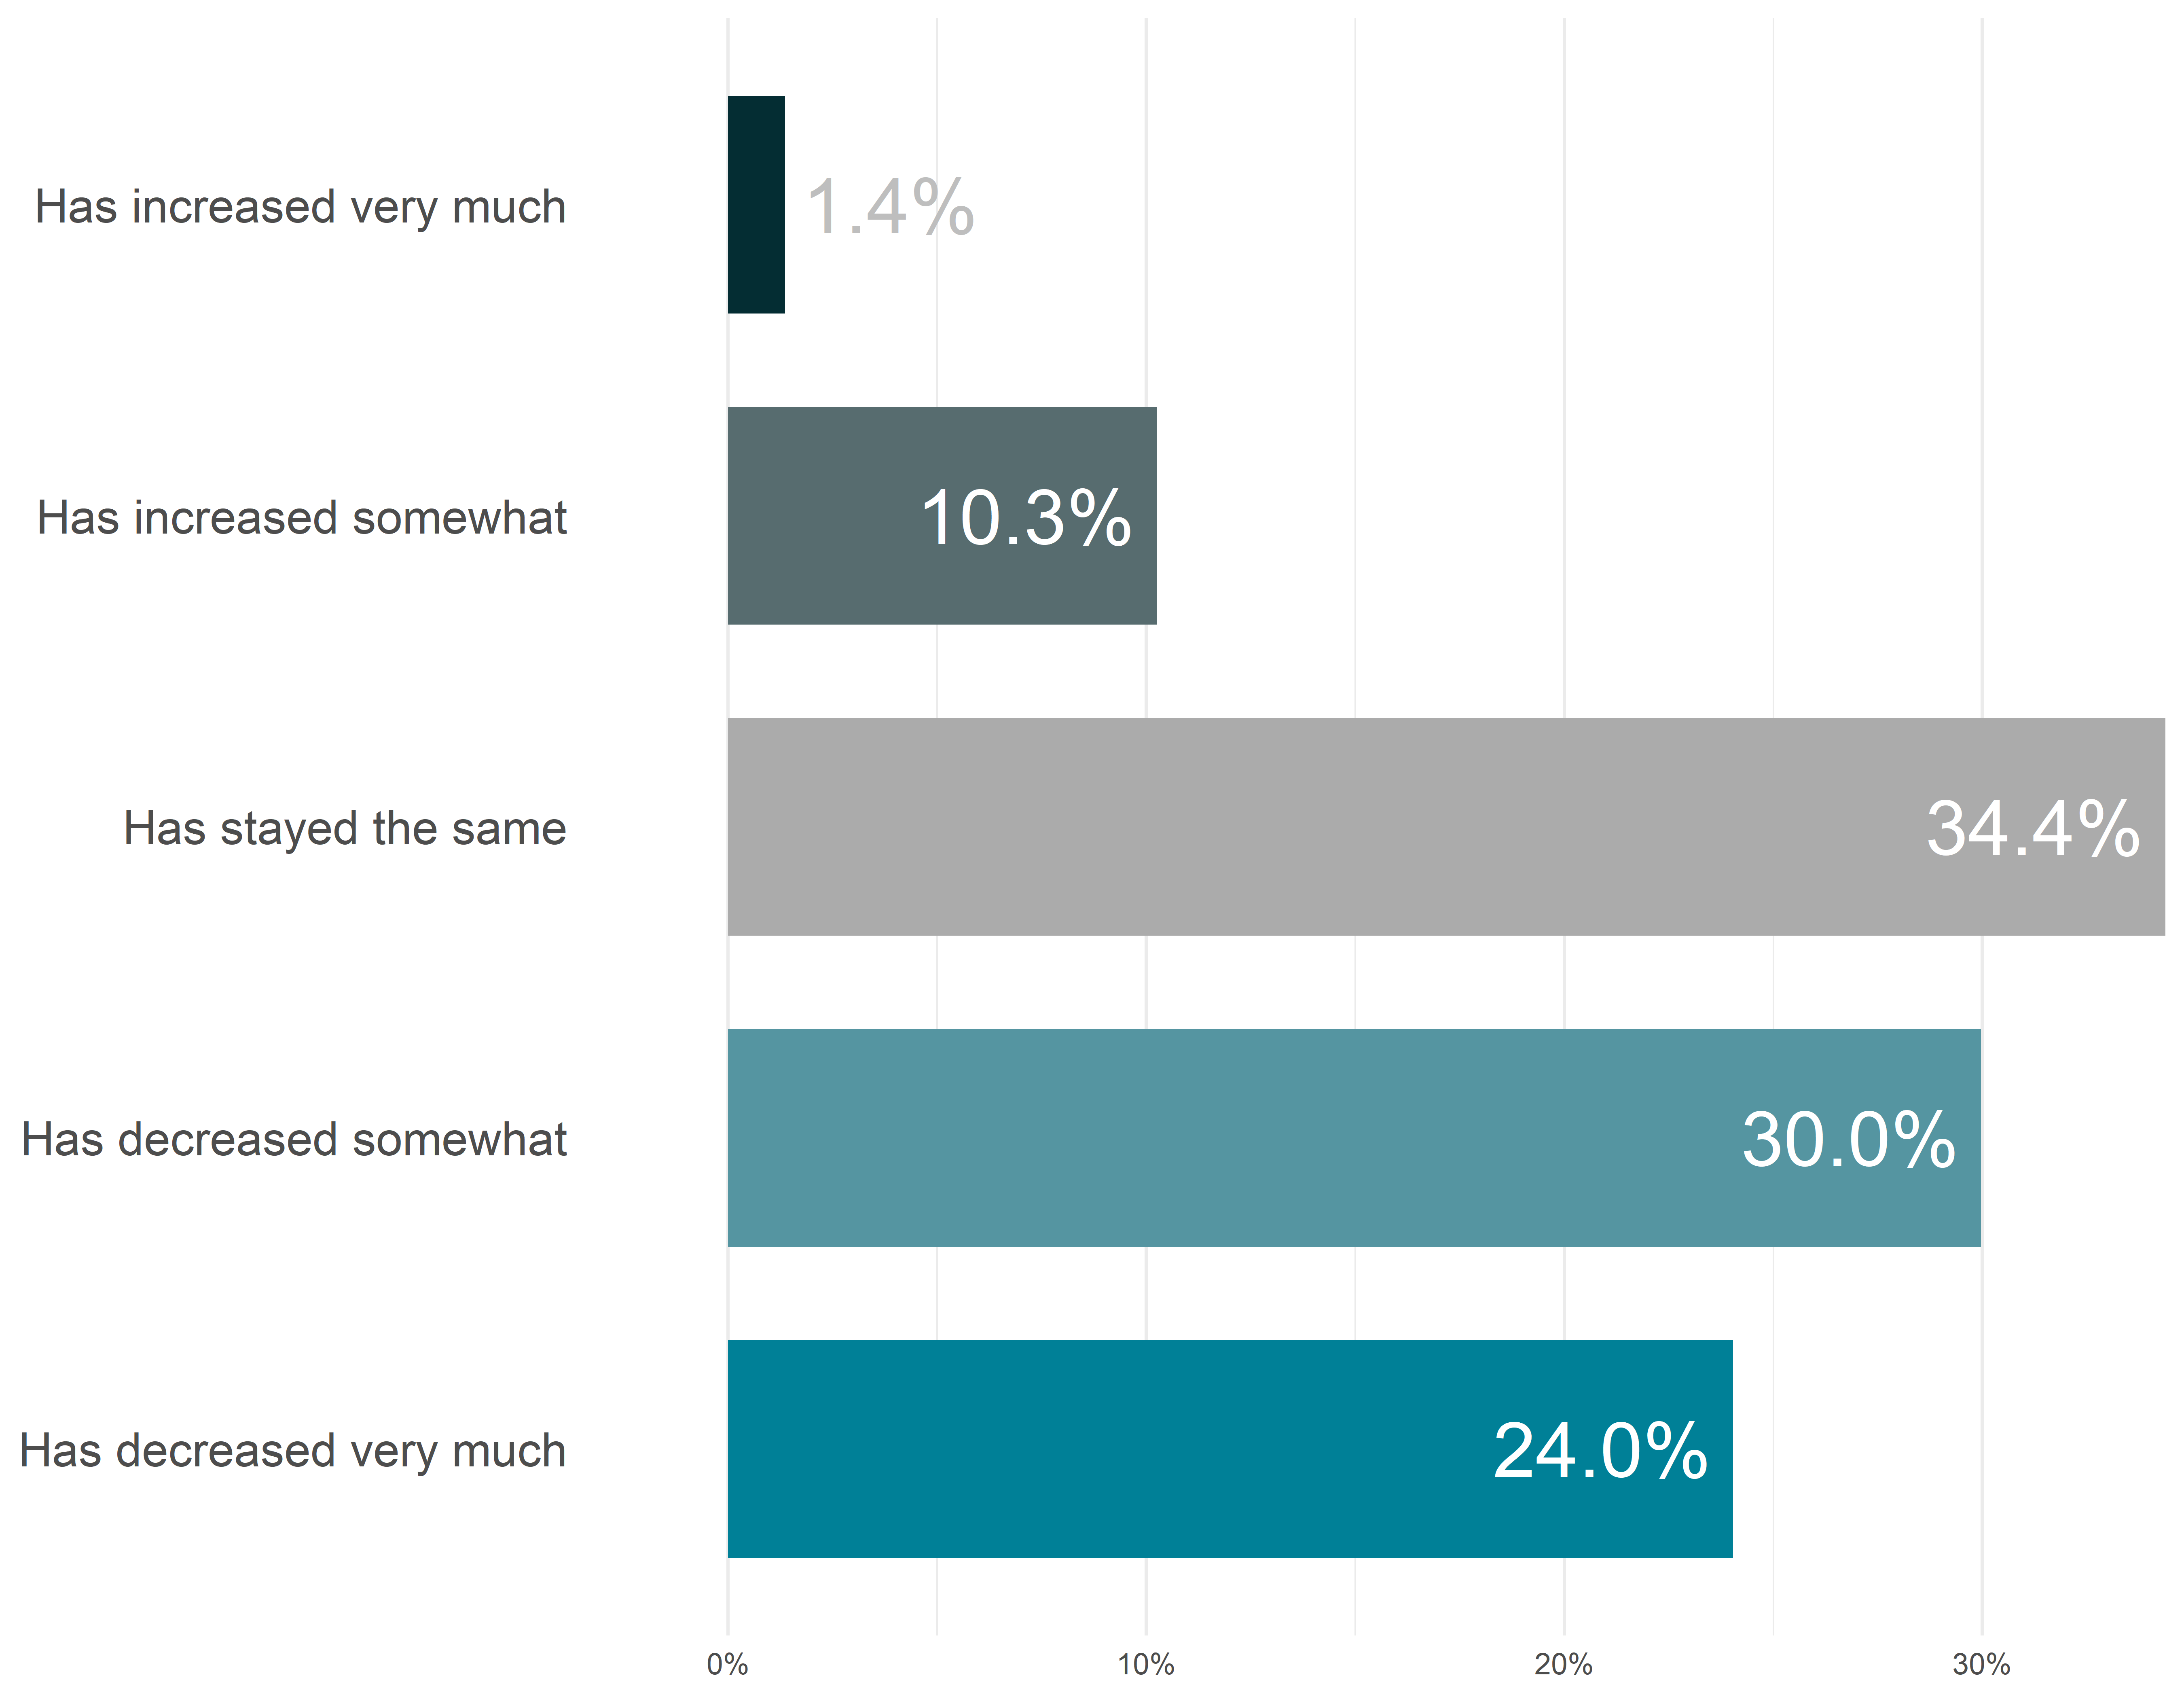
Which of the following best describes what has happened to your family income in the past month?
Rate of response: 99.2%
53.5% of respondents report a decrease in monthly income, while only 11.6% report an increase.
46.9% of respondents with at least one child aged 6 or younger report a decrease in monthly income, compared to 13.0% reporting an increase.
CPAL.EHQ.002
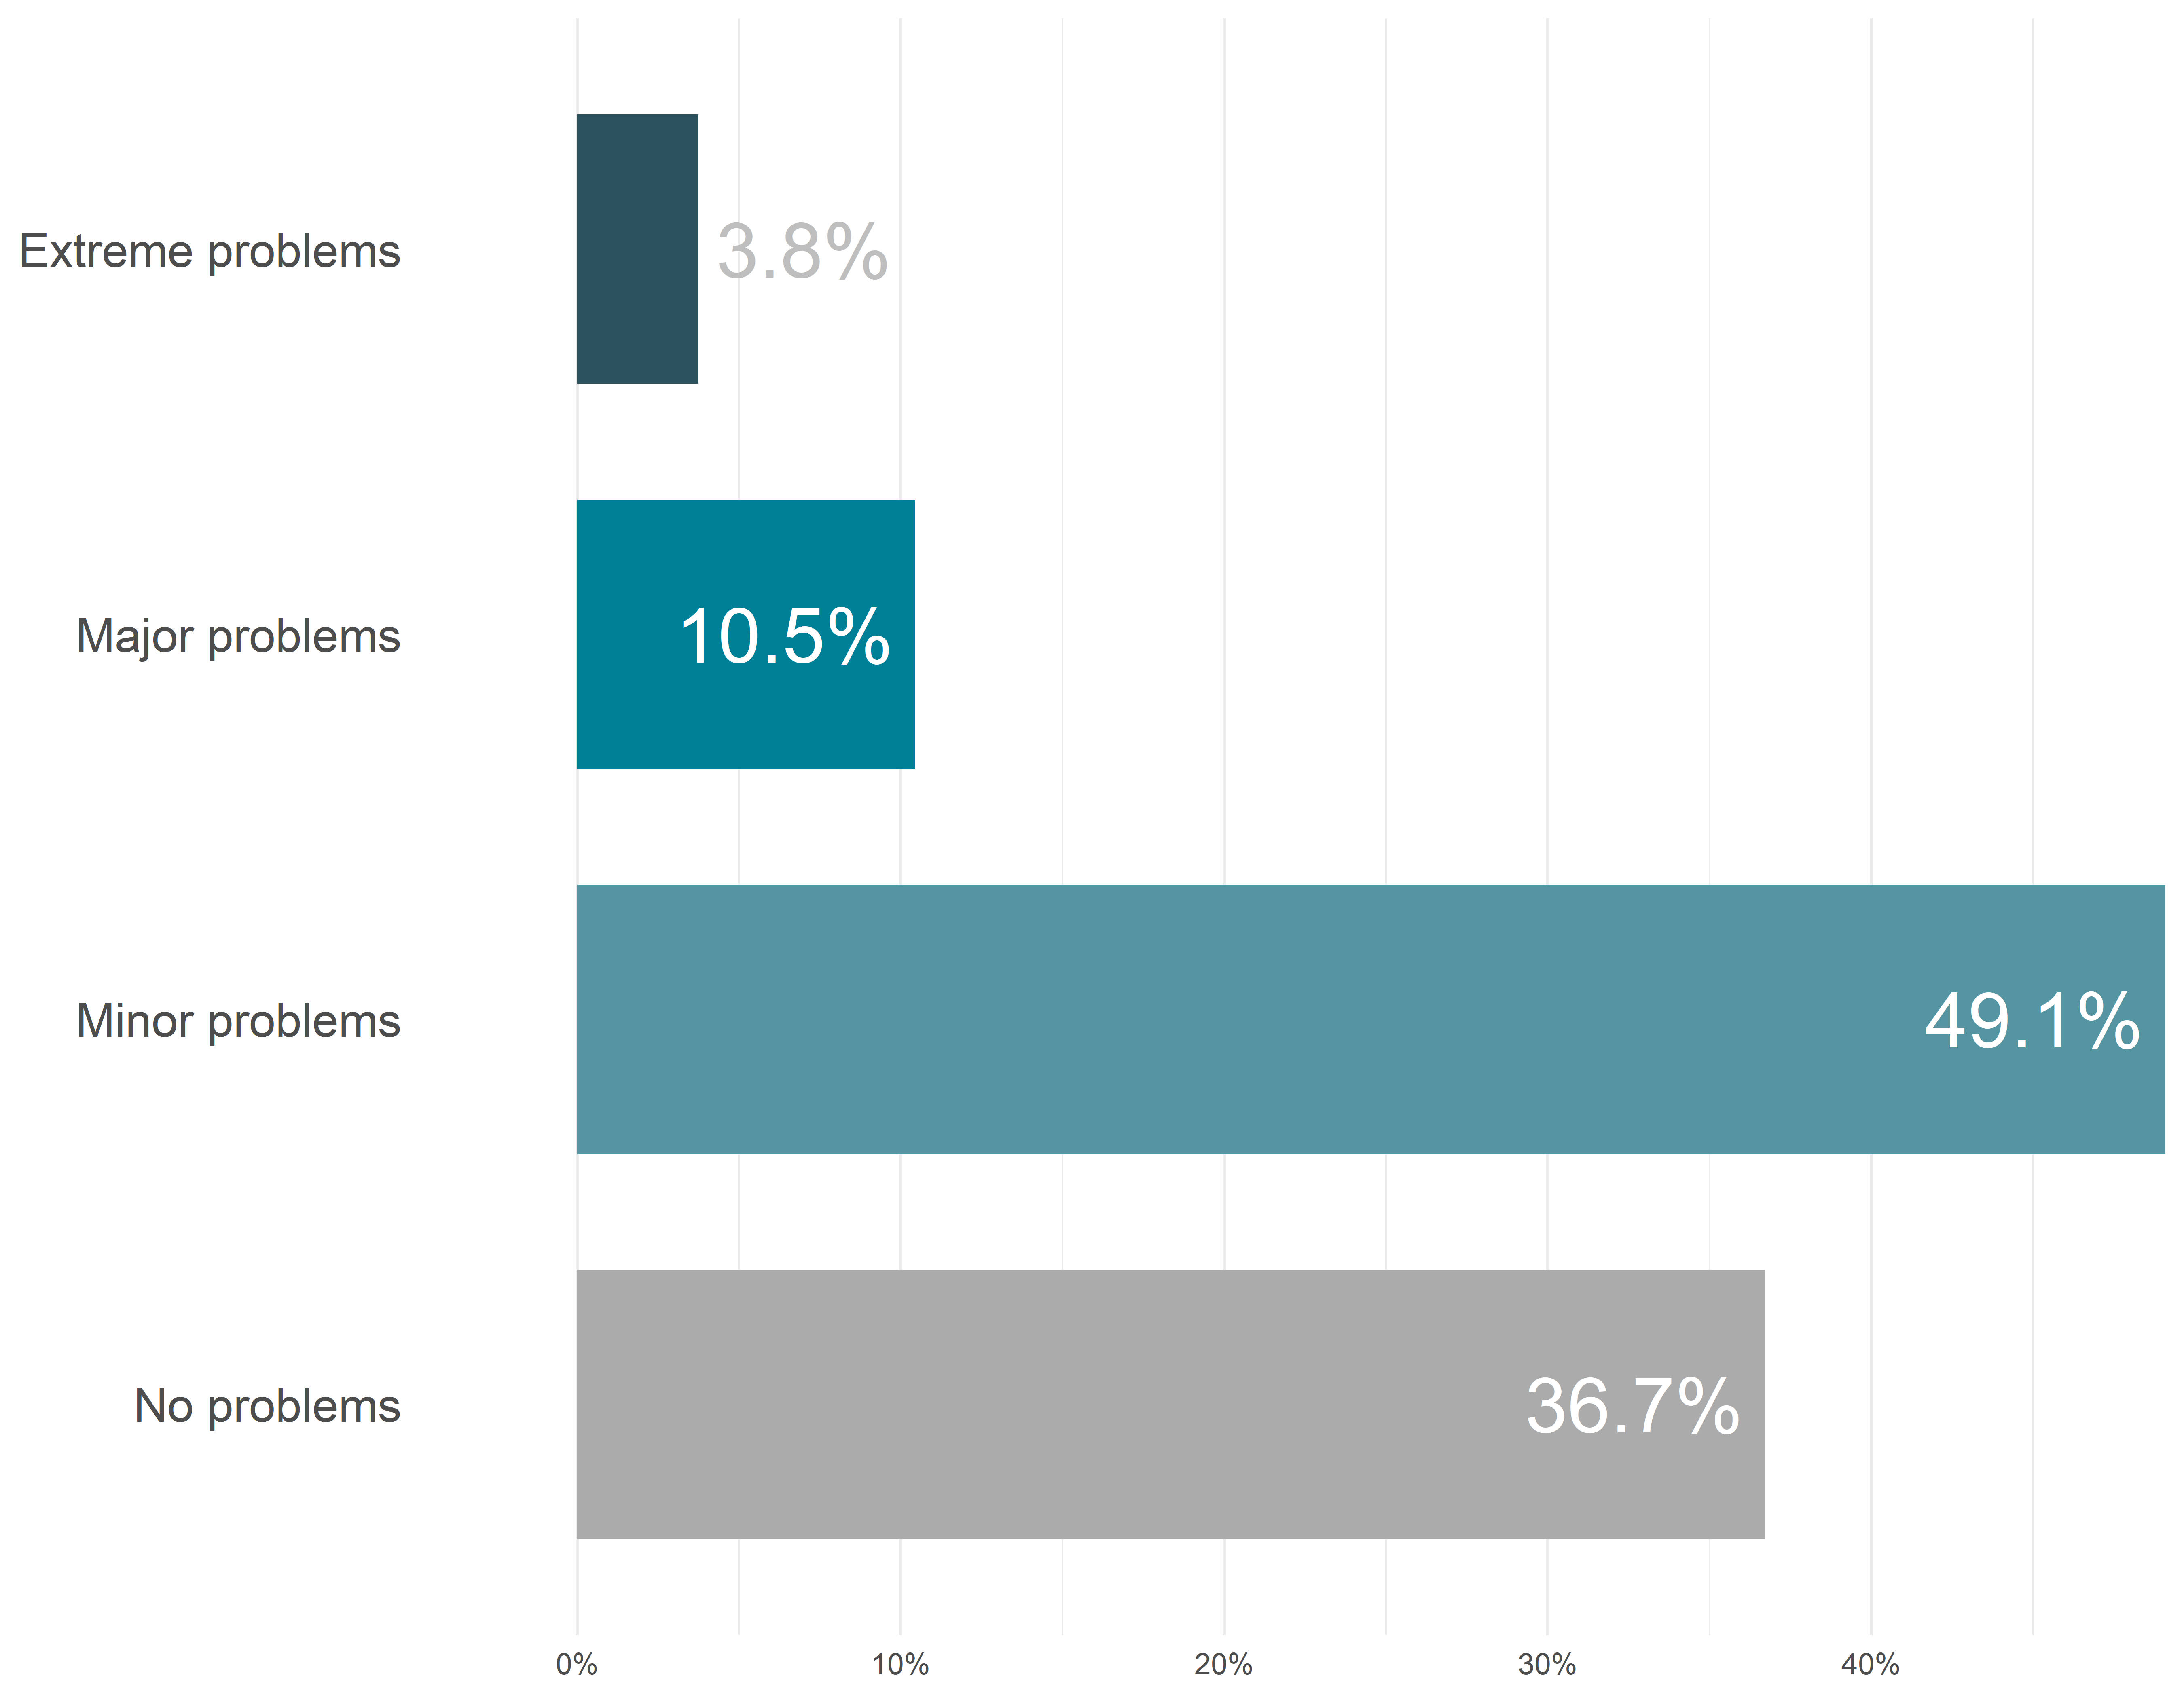
Which of the following best describes your family financially at this time?
Rate of response: 99.5%
63.0% of respondents report at least some family financial problems.
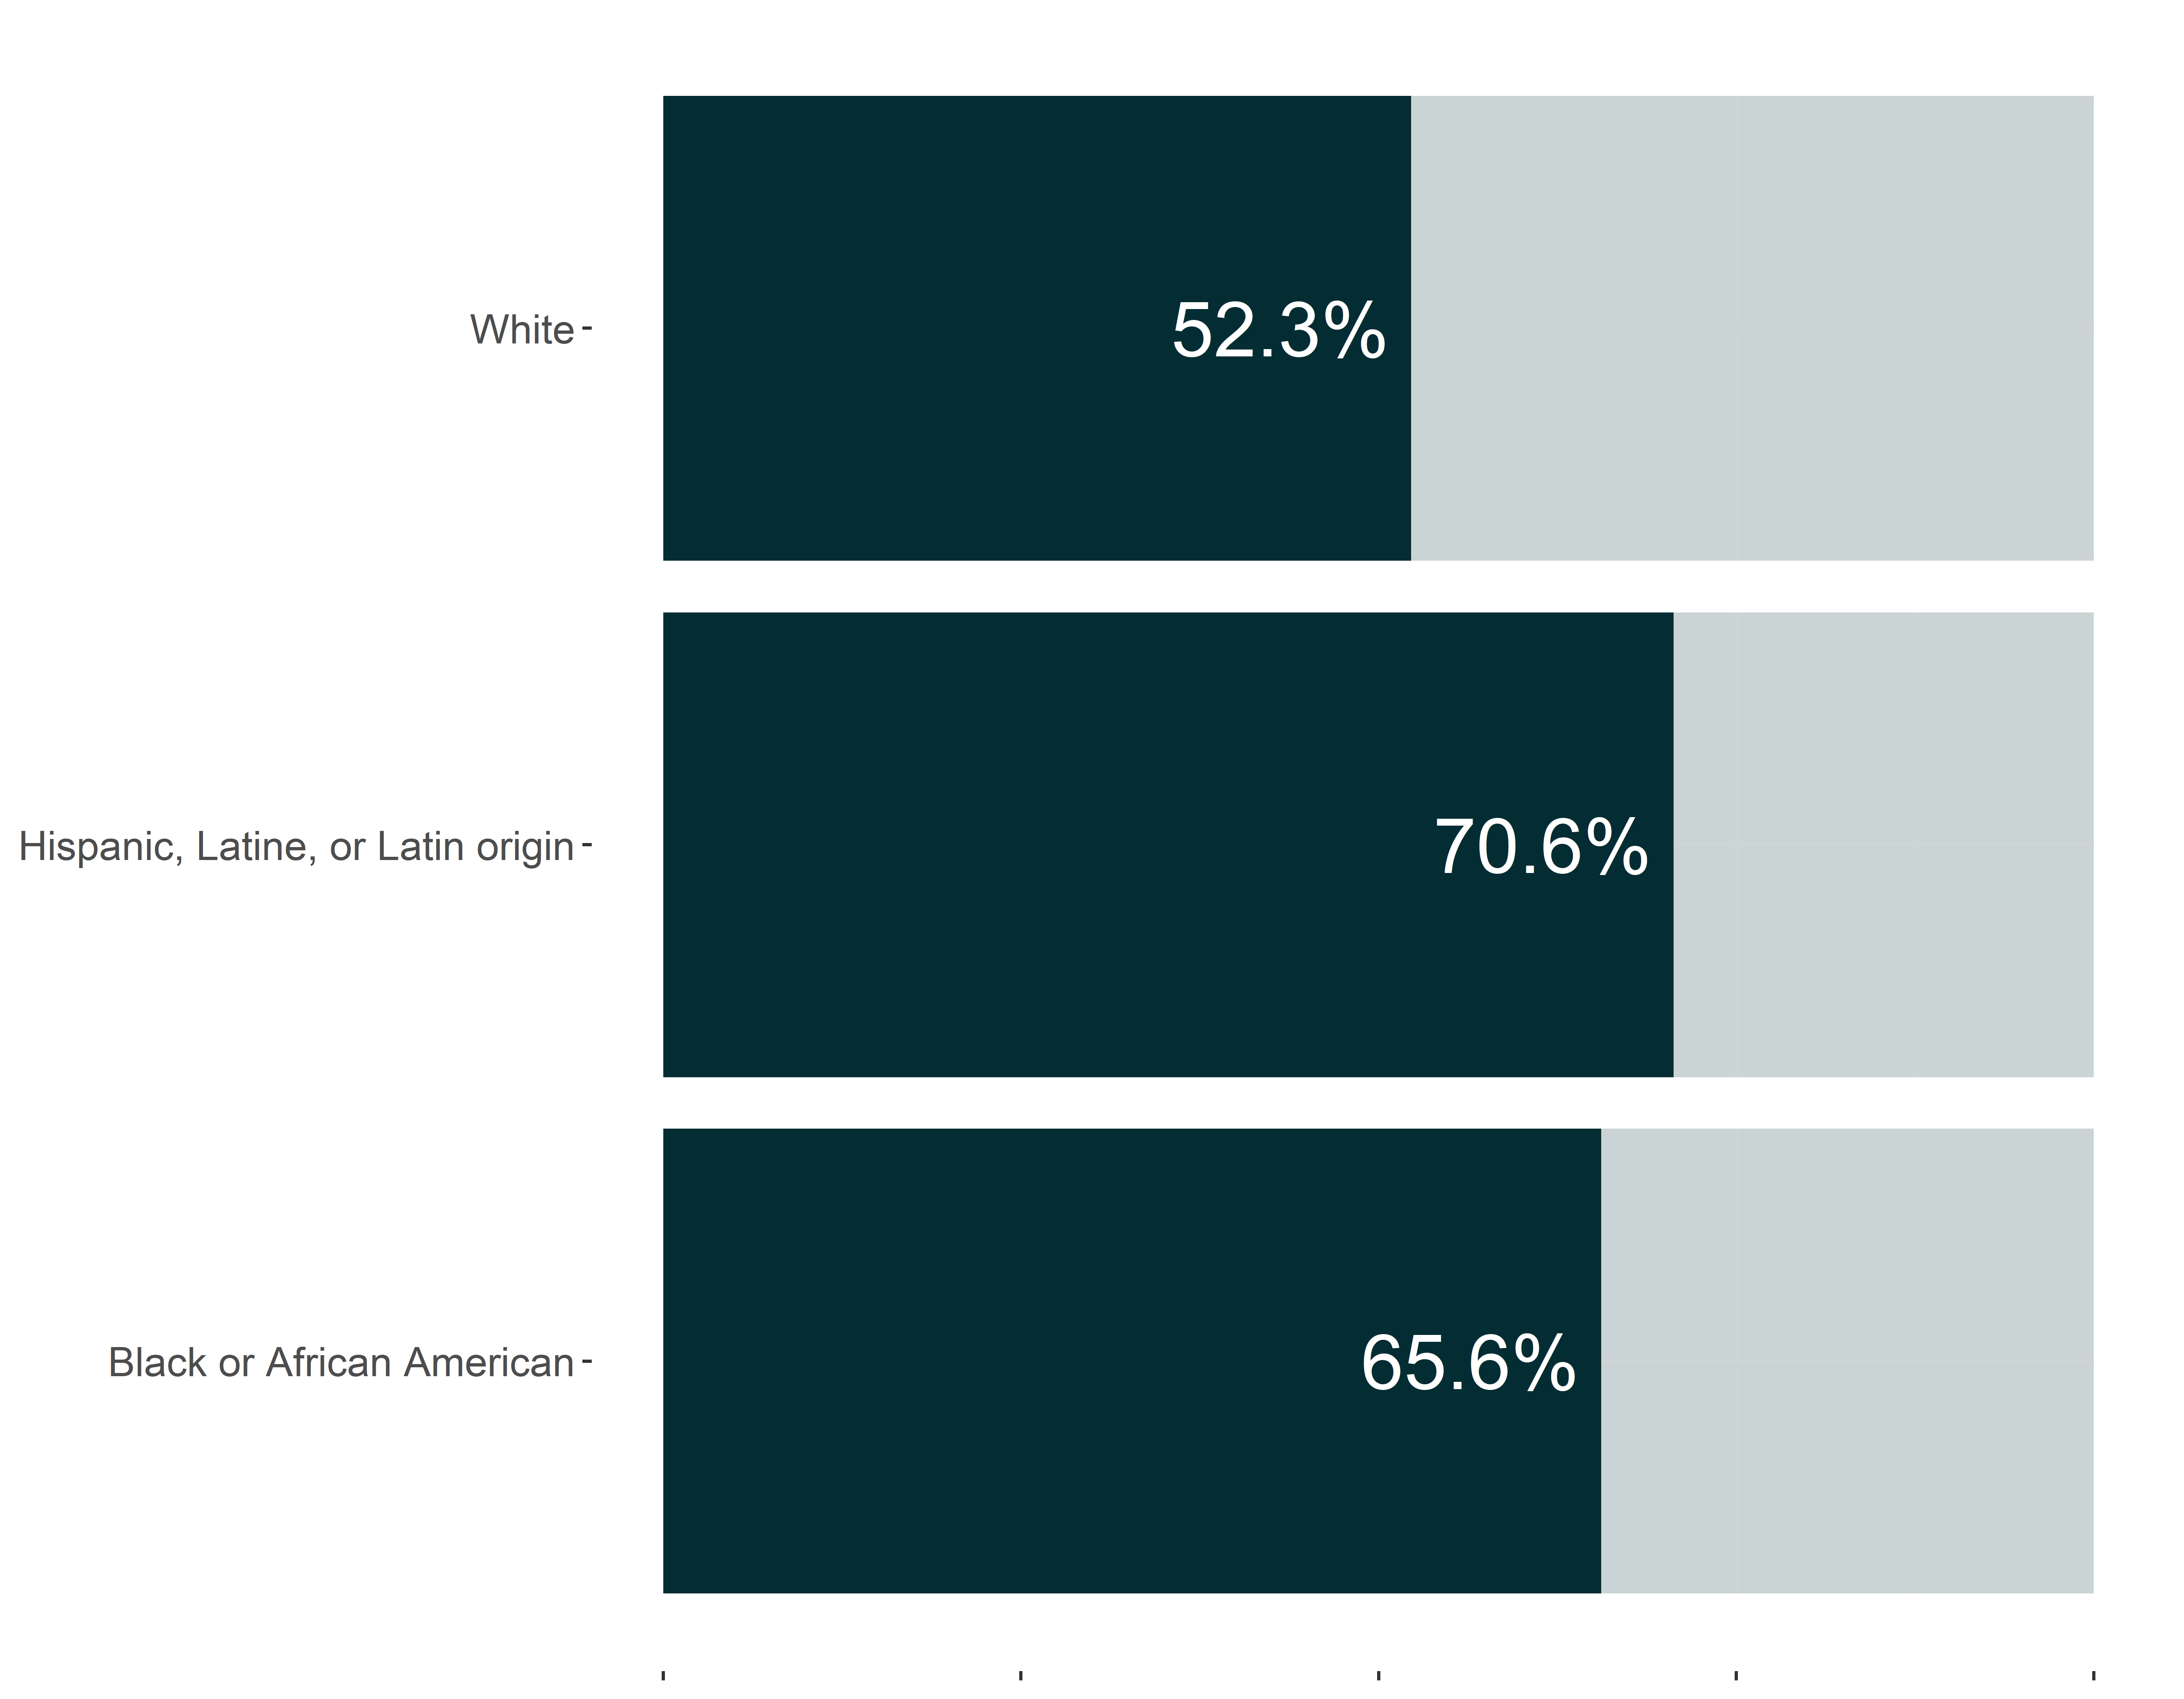
White respondents are least likely to report any financial hardships.
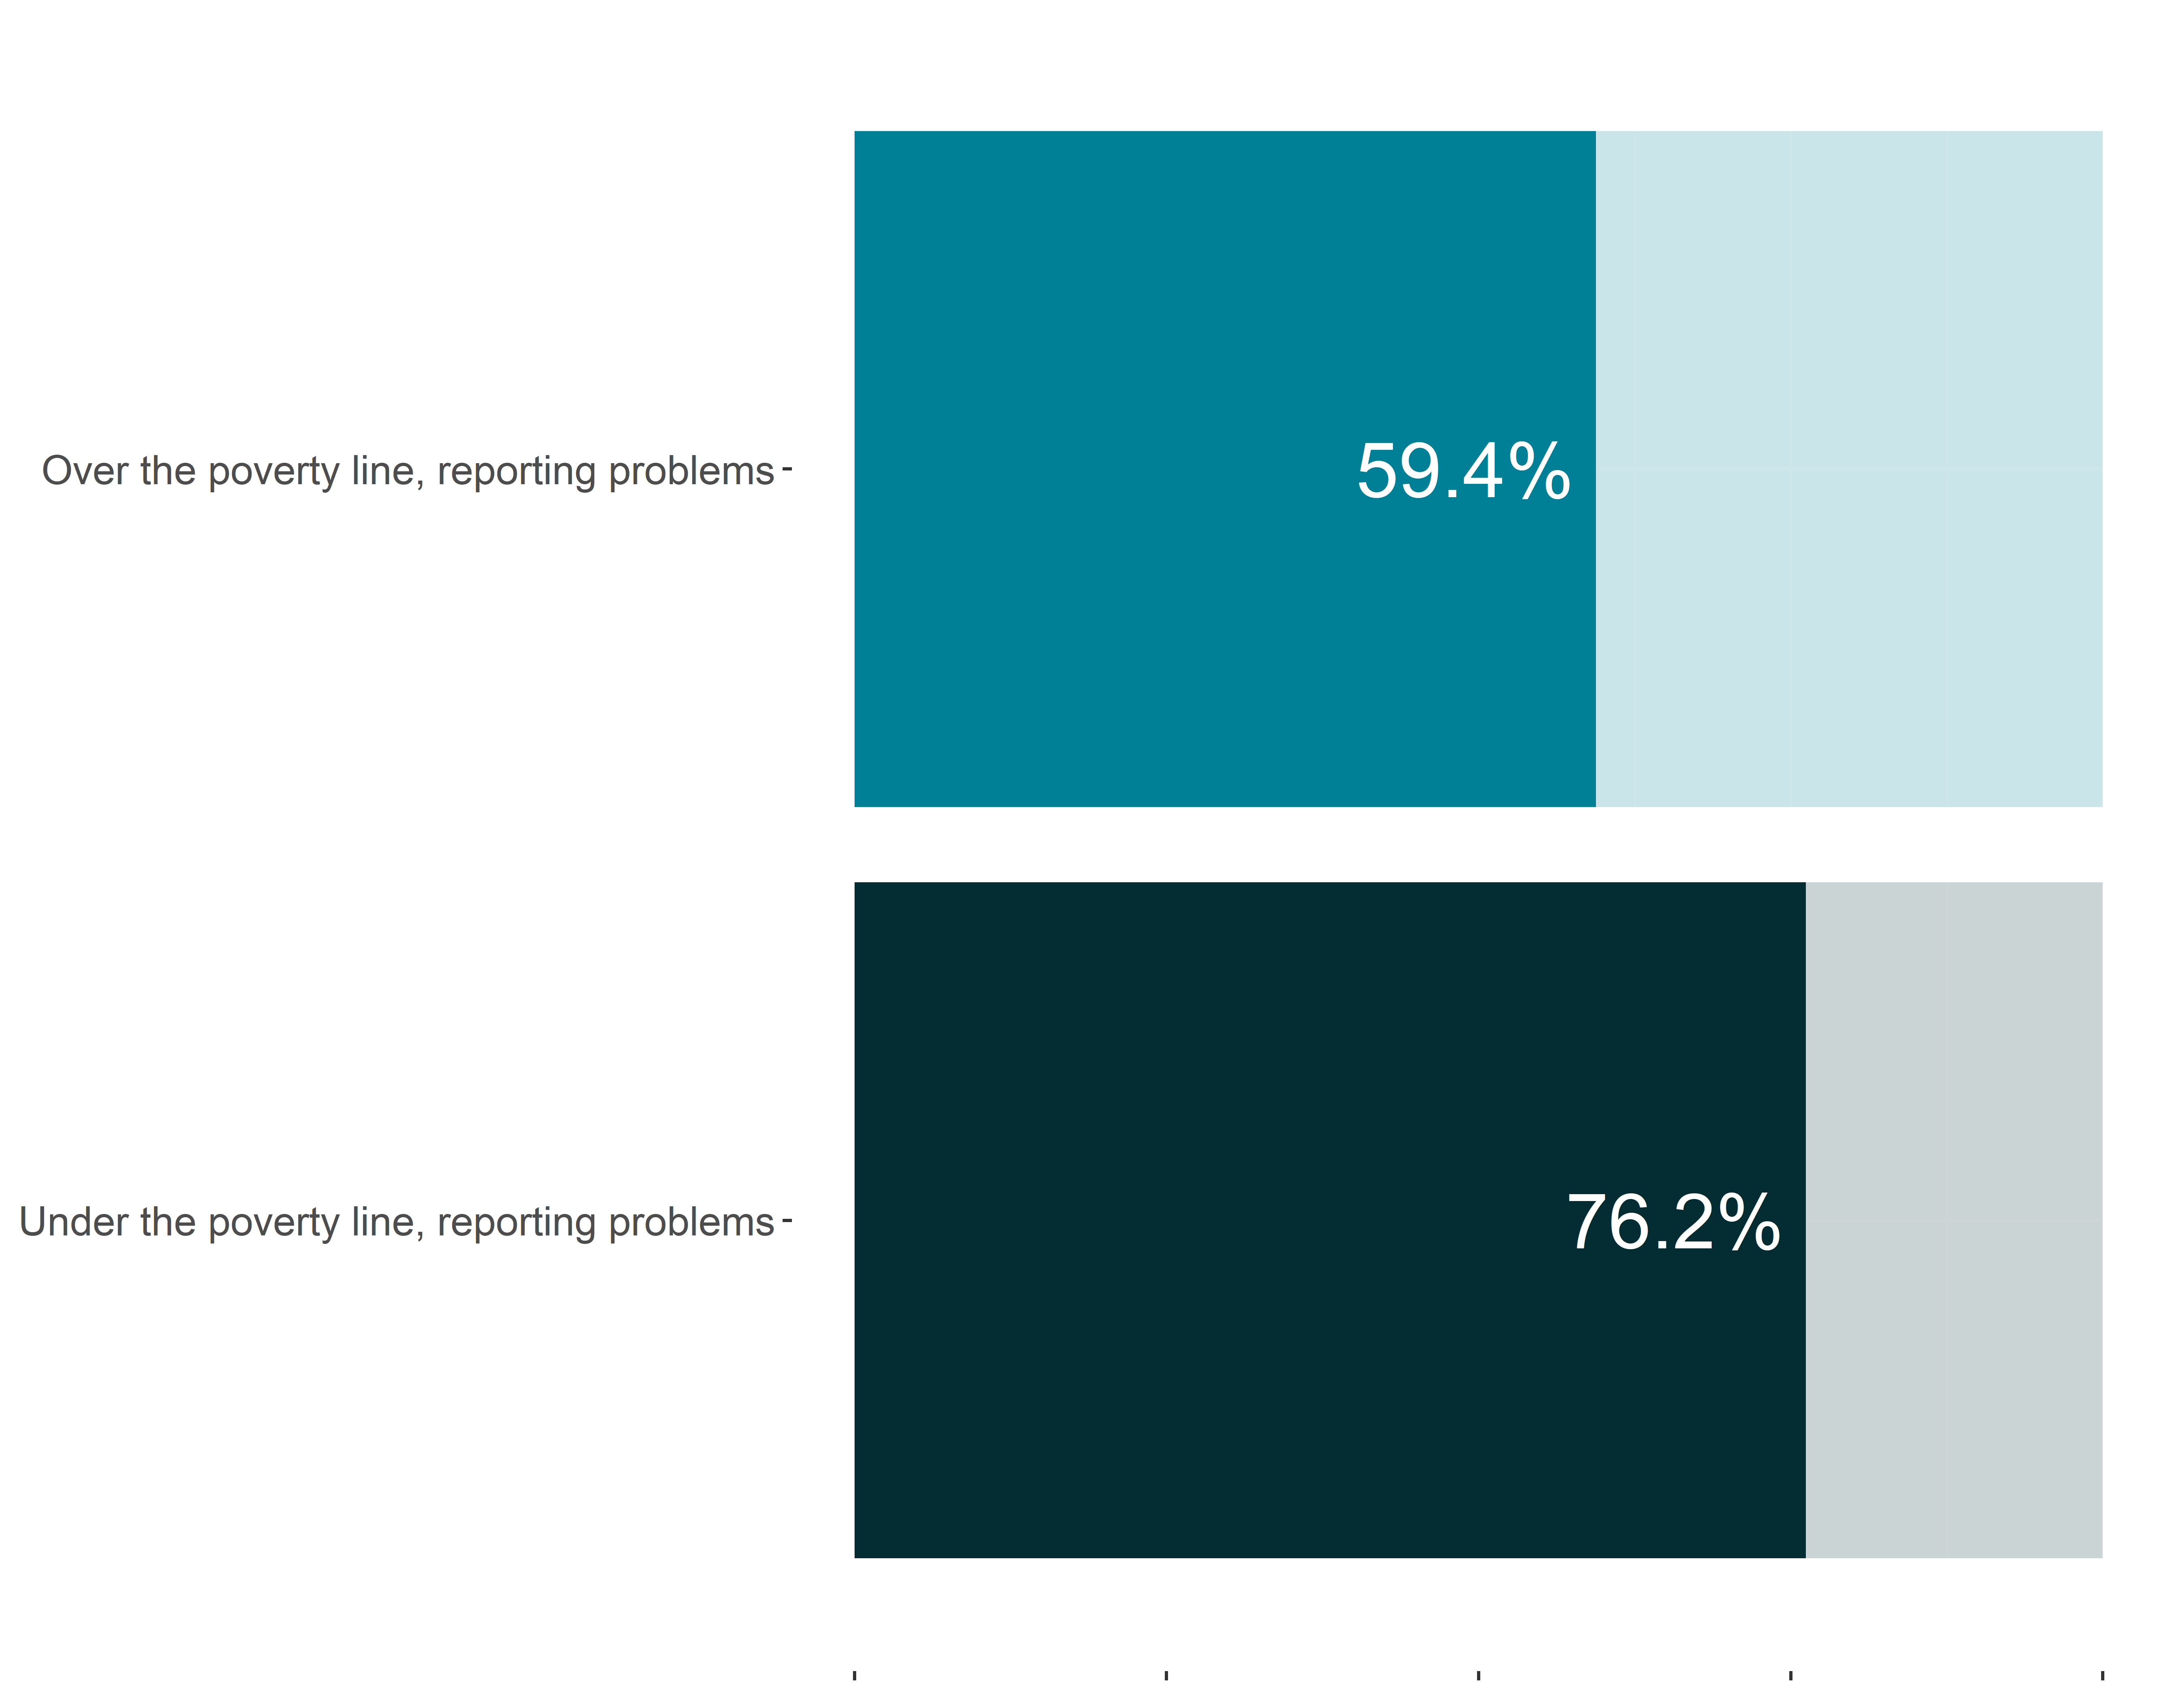
75.9% of those under the poverty line report family financial problems, as do 59.1% of those above the poverty line.**
CPAL.FSTR.001
In the past month, how hard has it been for your family to pay for the very basics like food, housing, medical care, and heating?
Rate of response: 99.7%
58.2% of respondents say paying for basics is difficult.
73.0% of respondents who report difficulty paying for basics are over the poverty line.
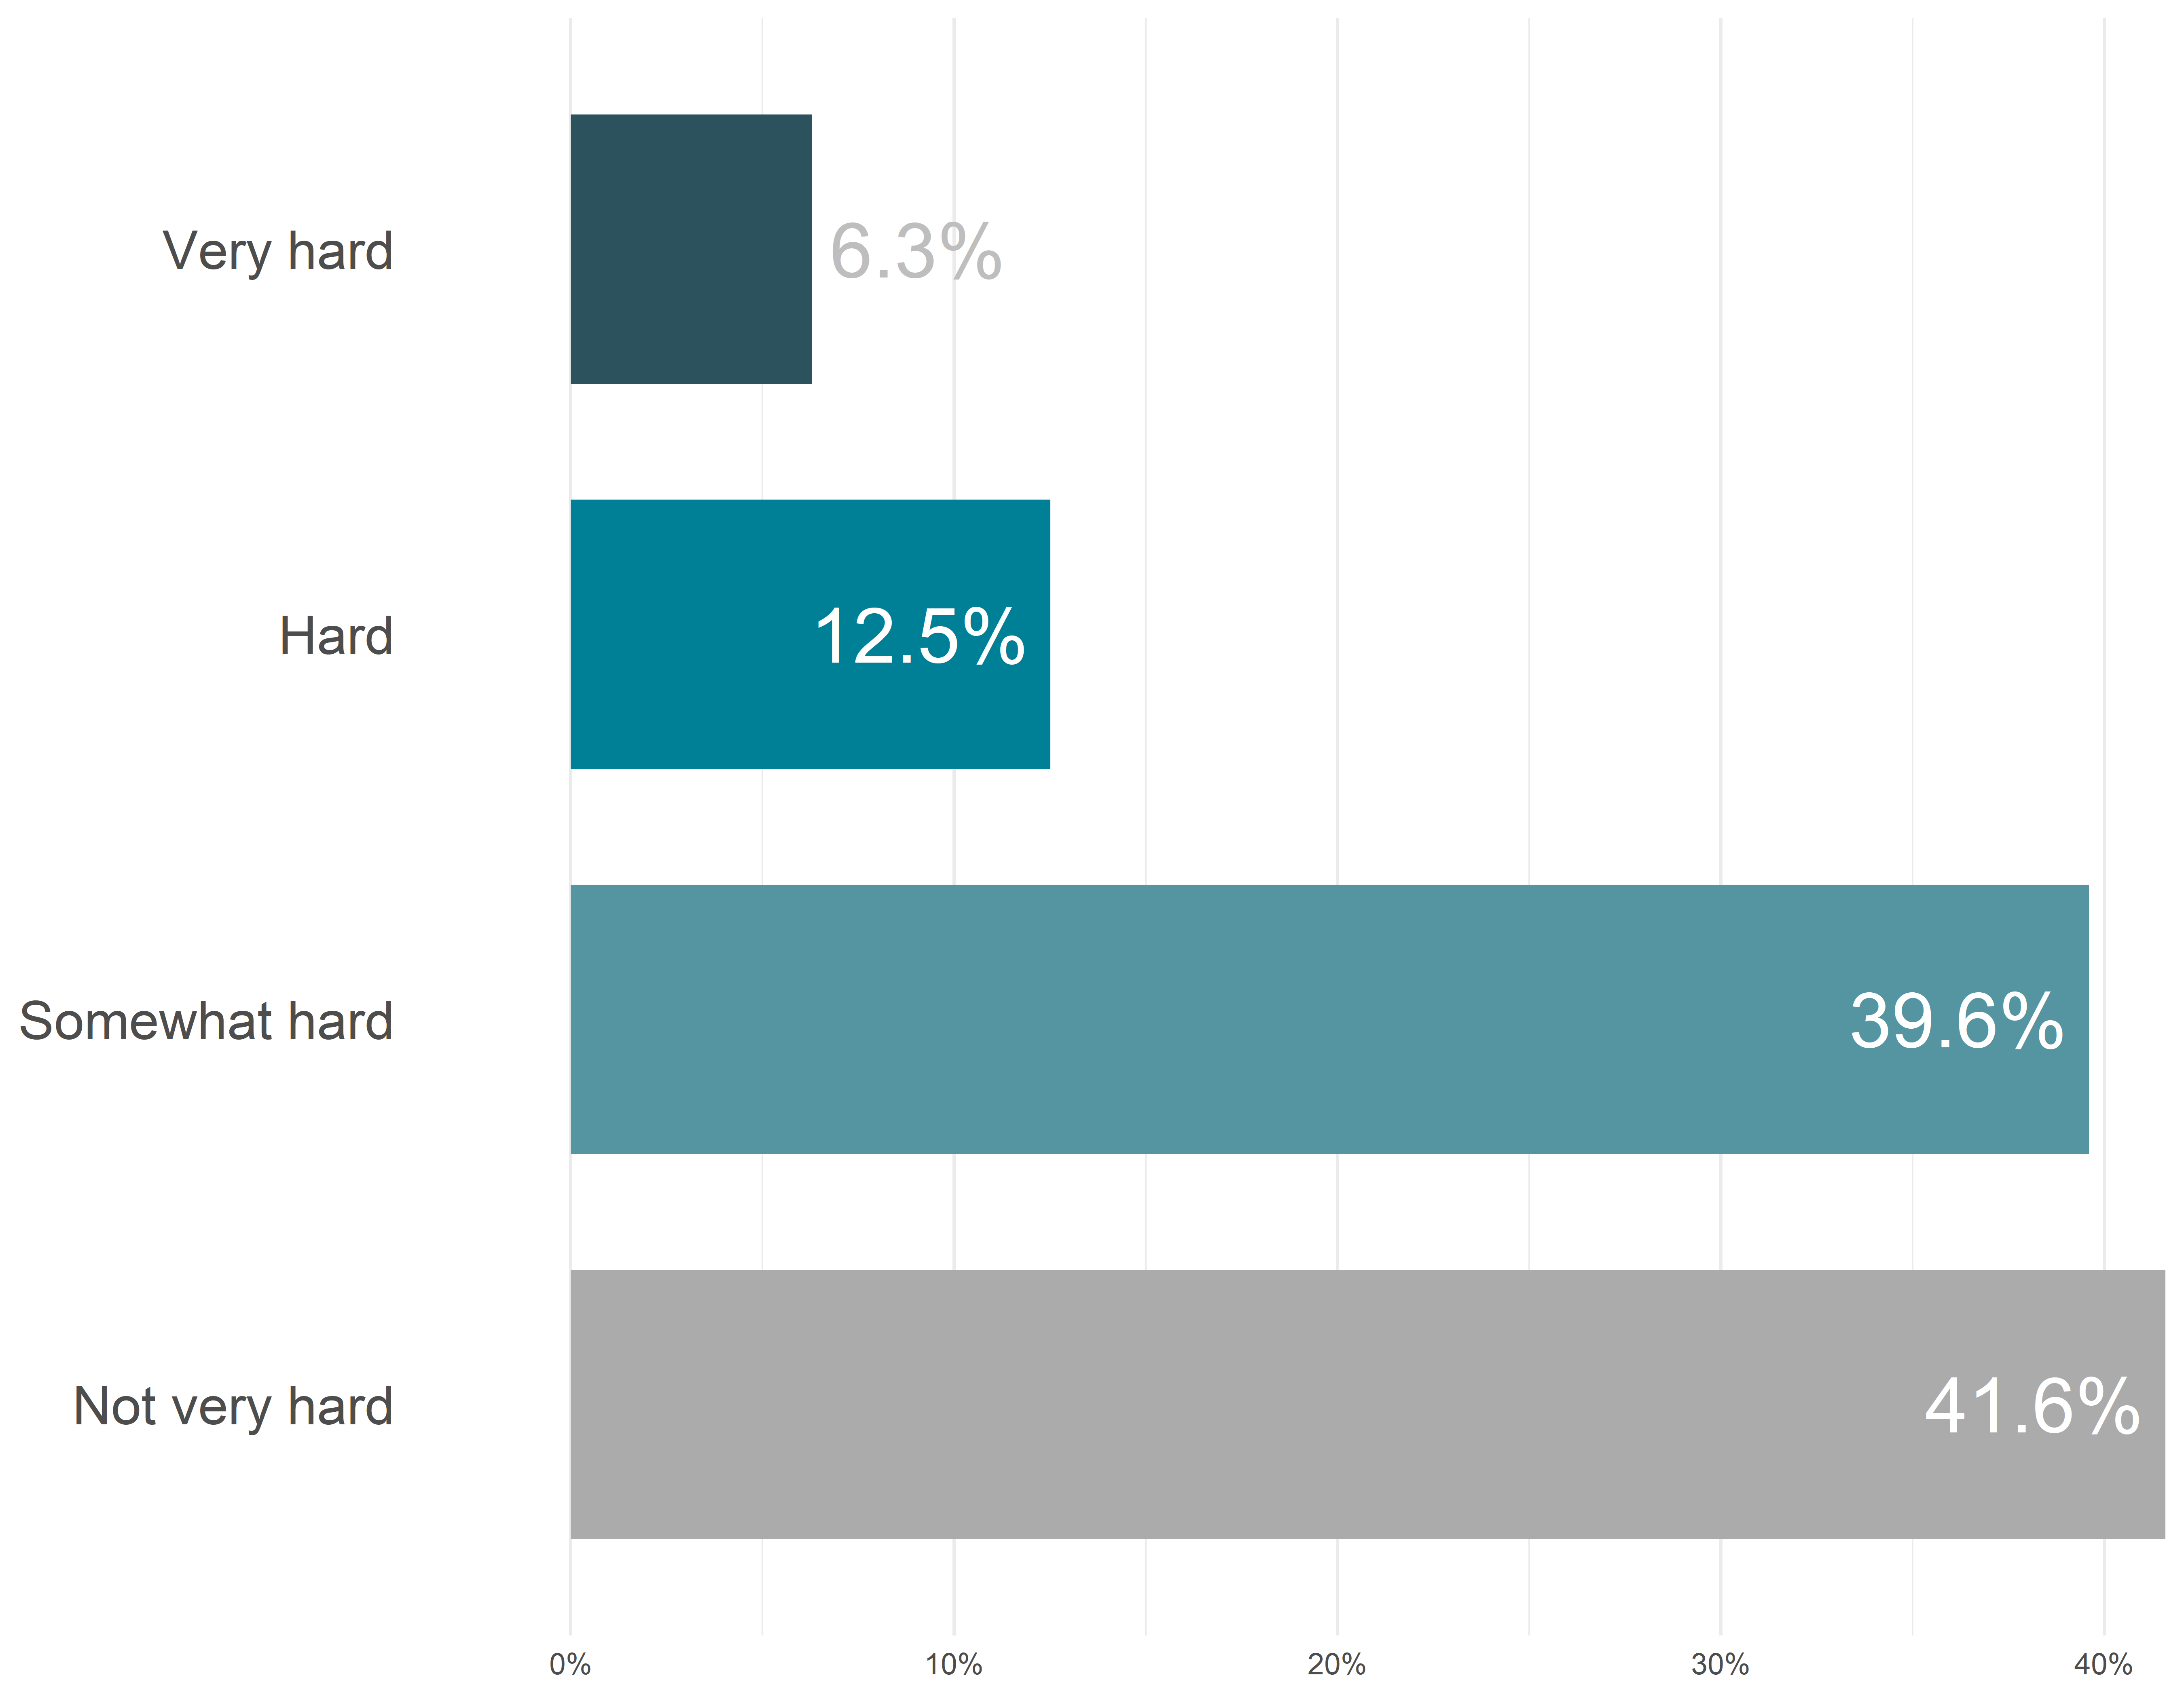
56.3% of respondents with at least one child 6 years old or younger report difficulty paying for basics.
CPAL.FTAX.001
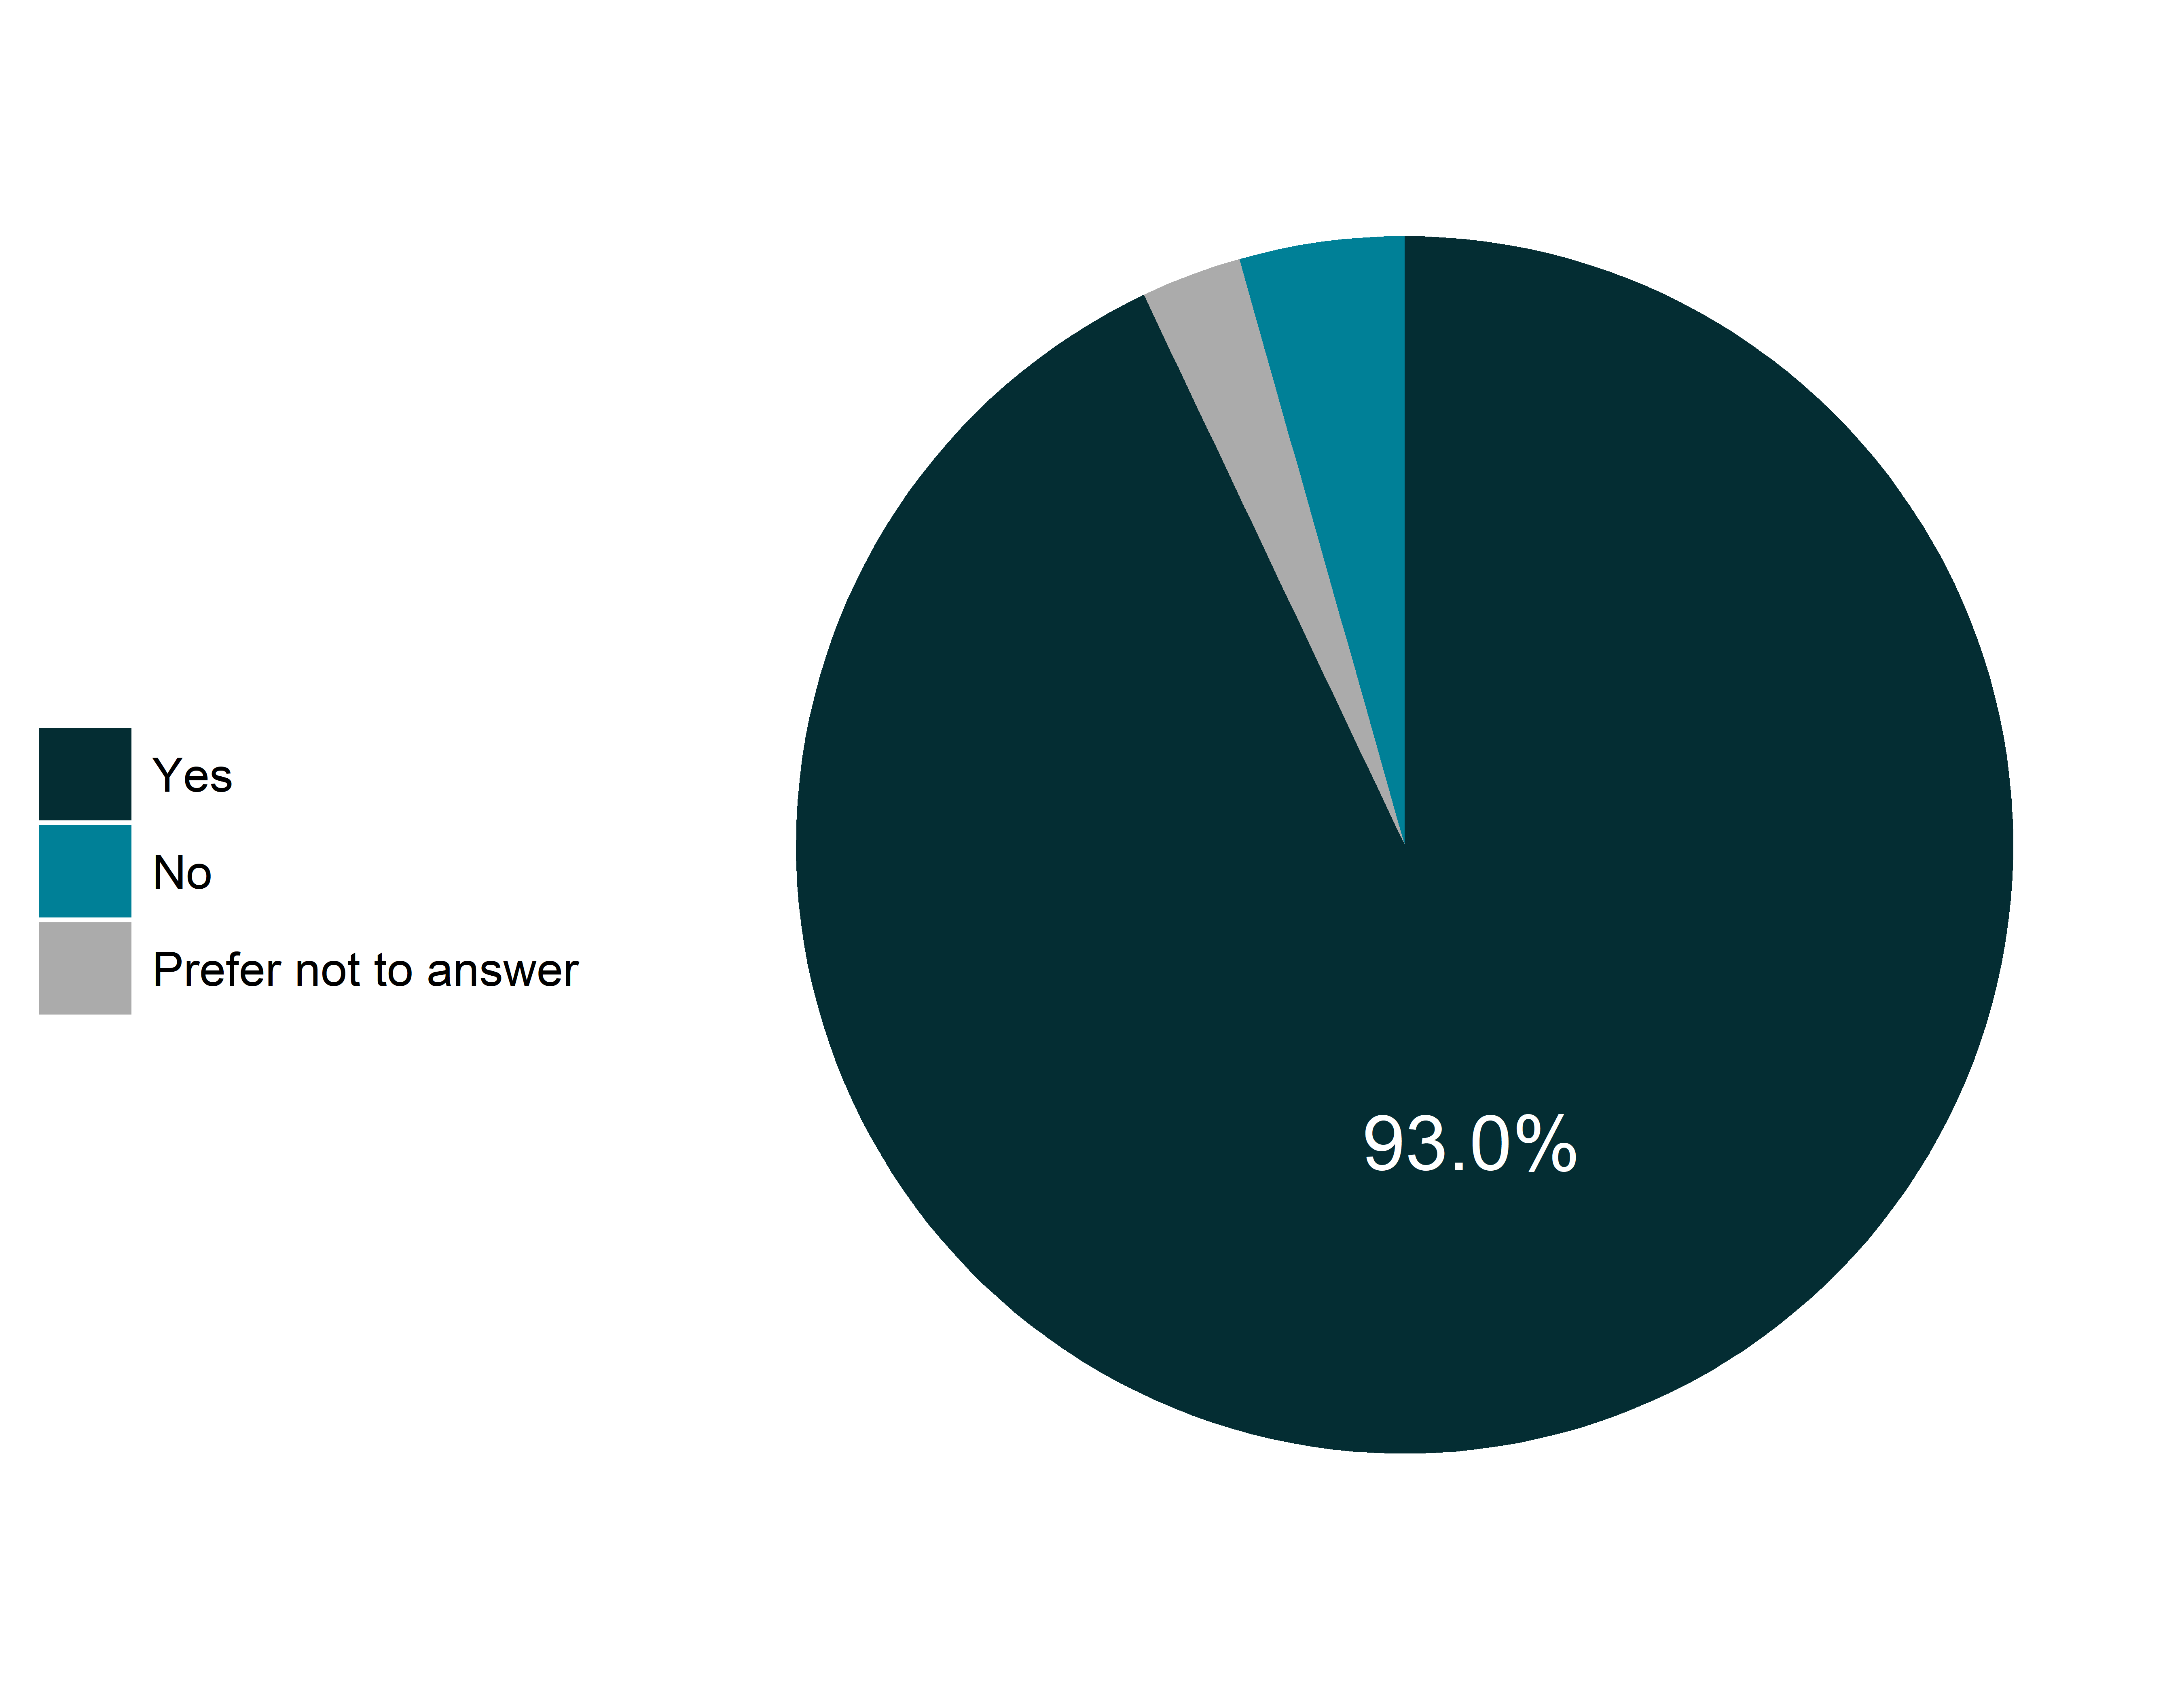
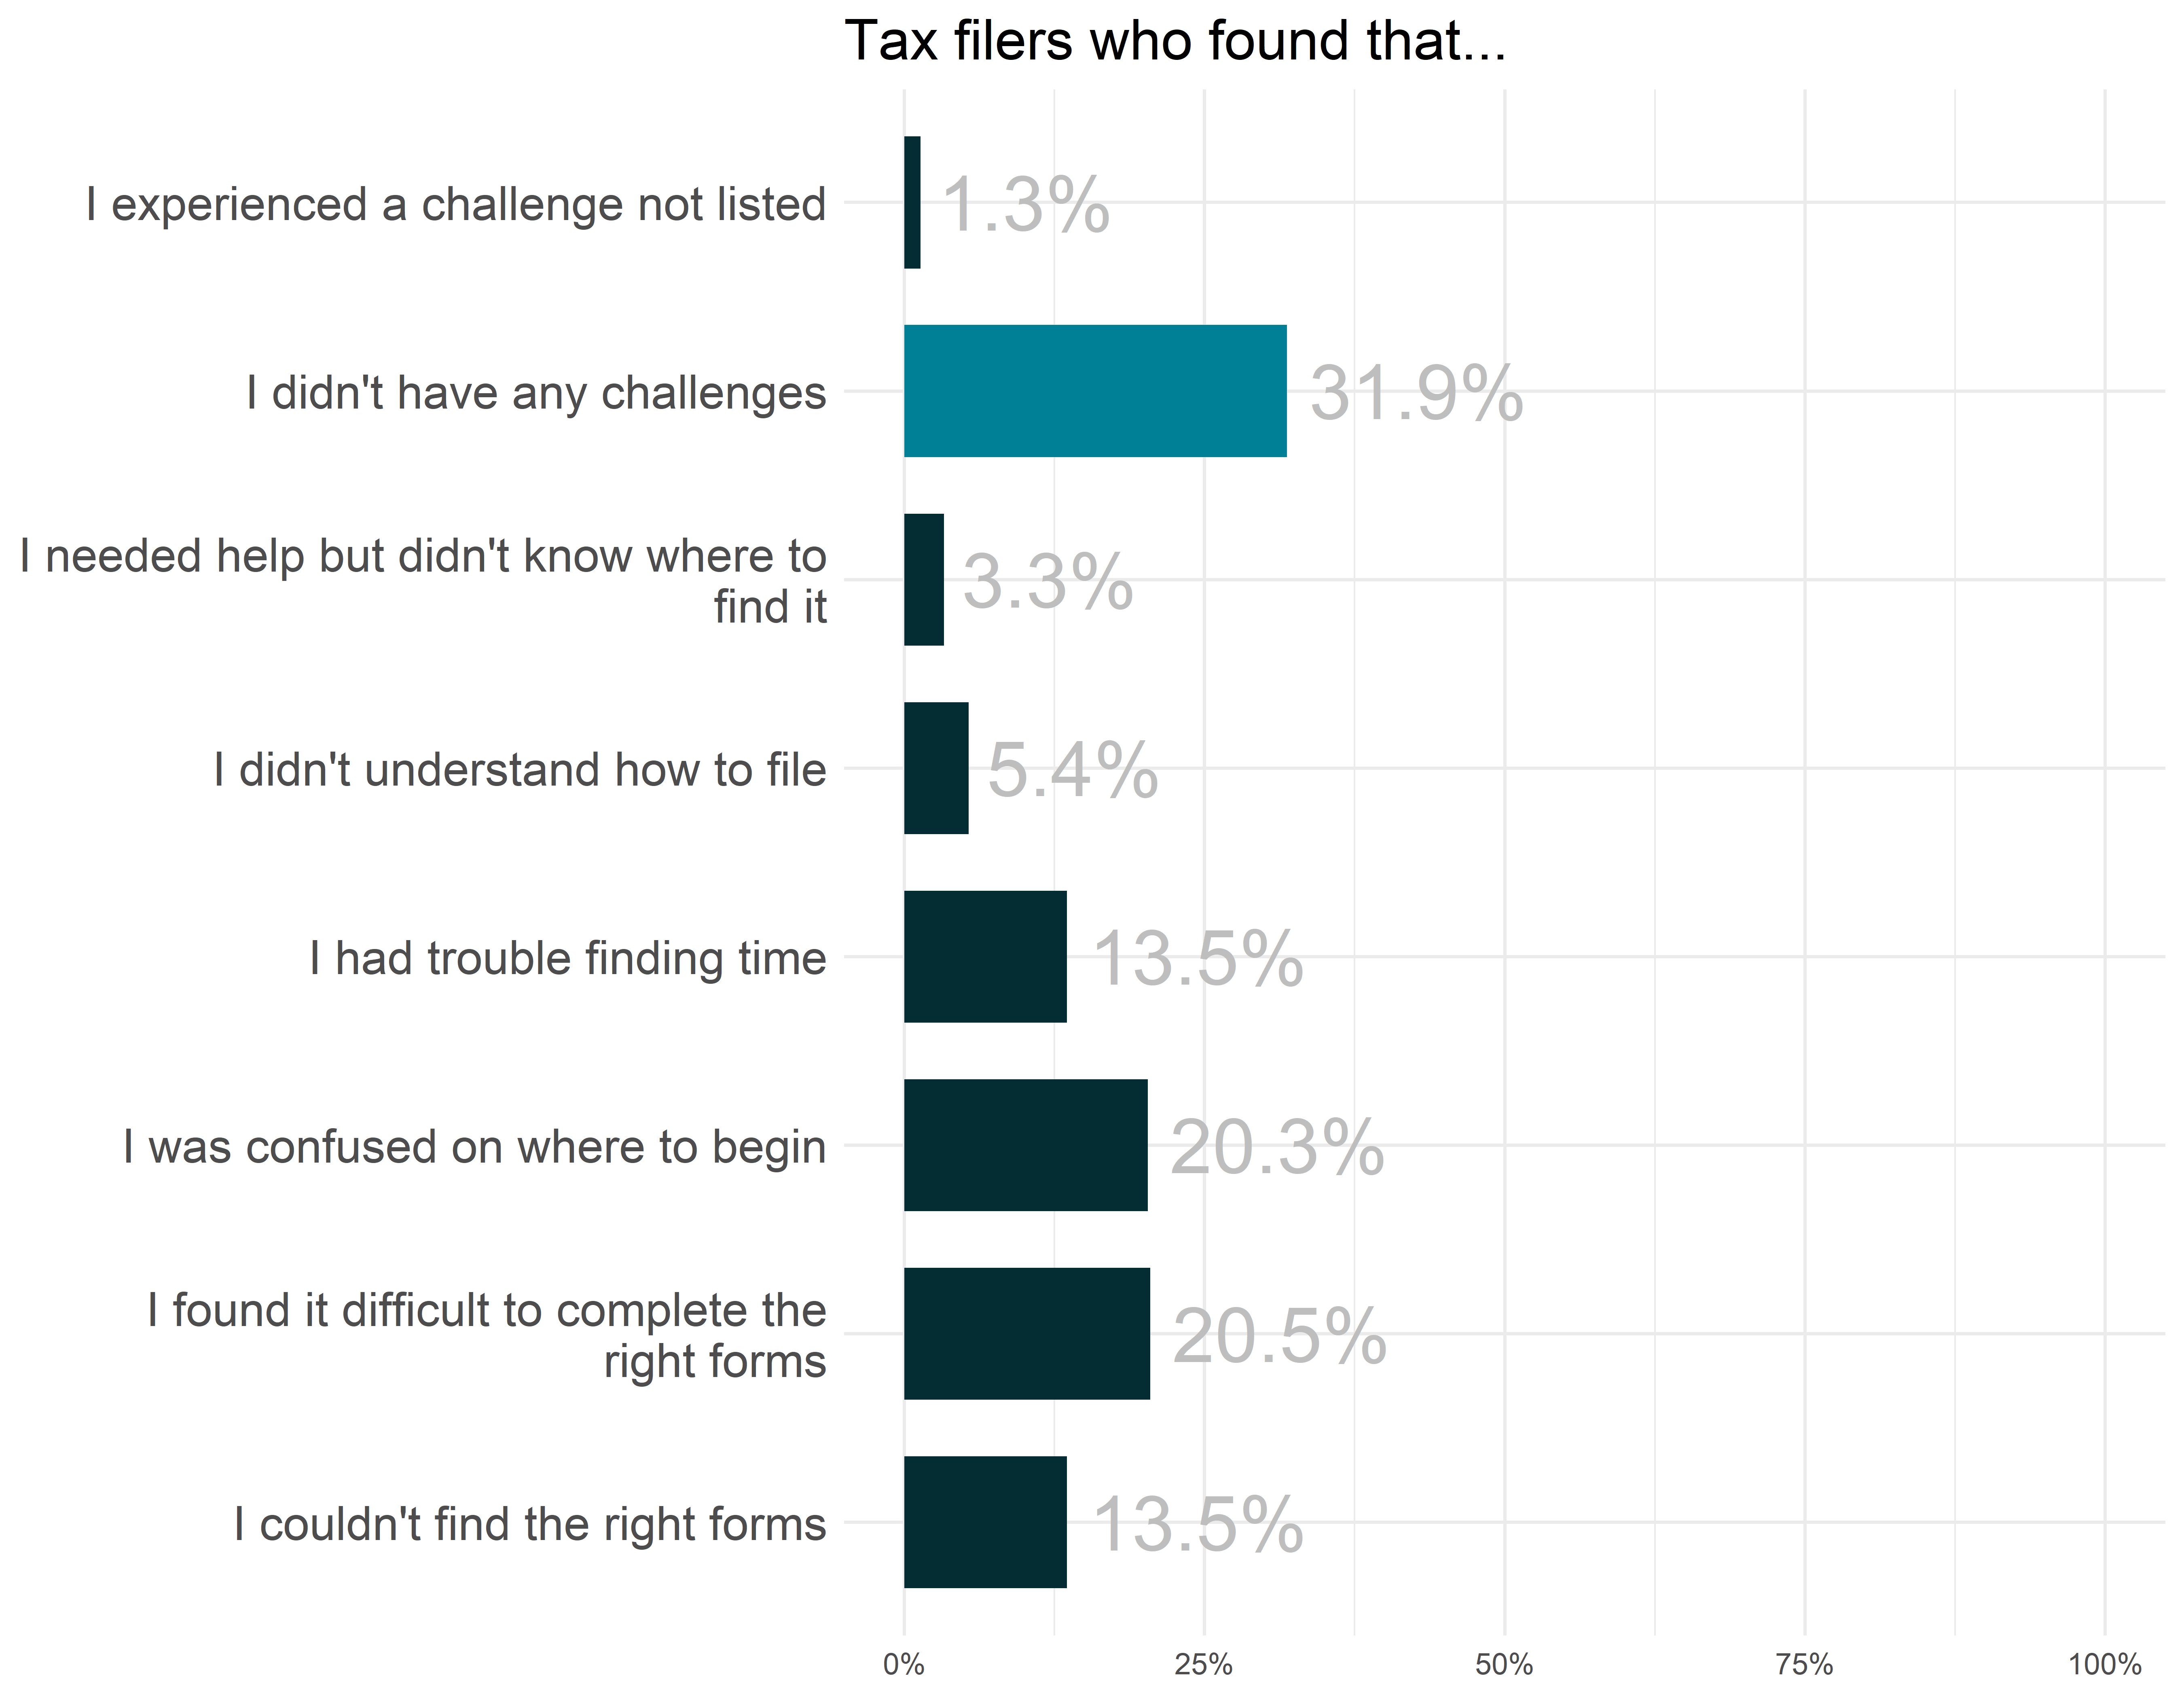
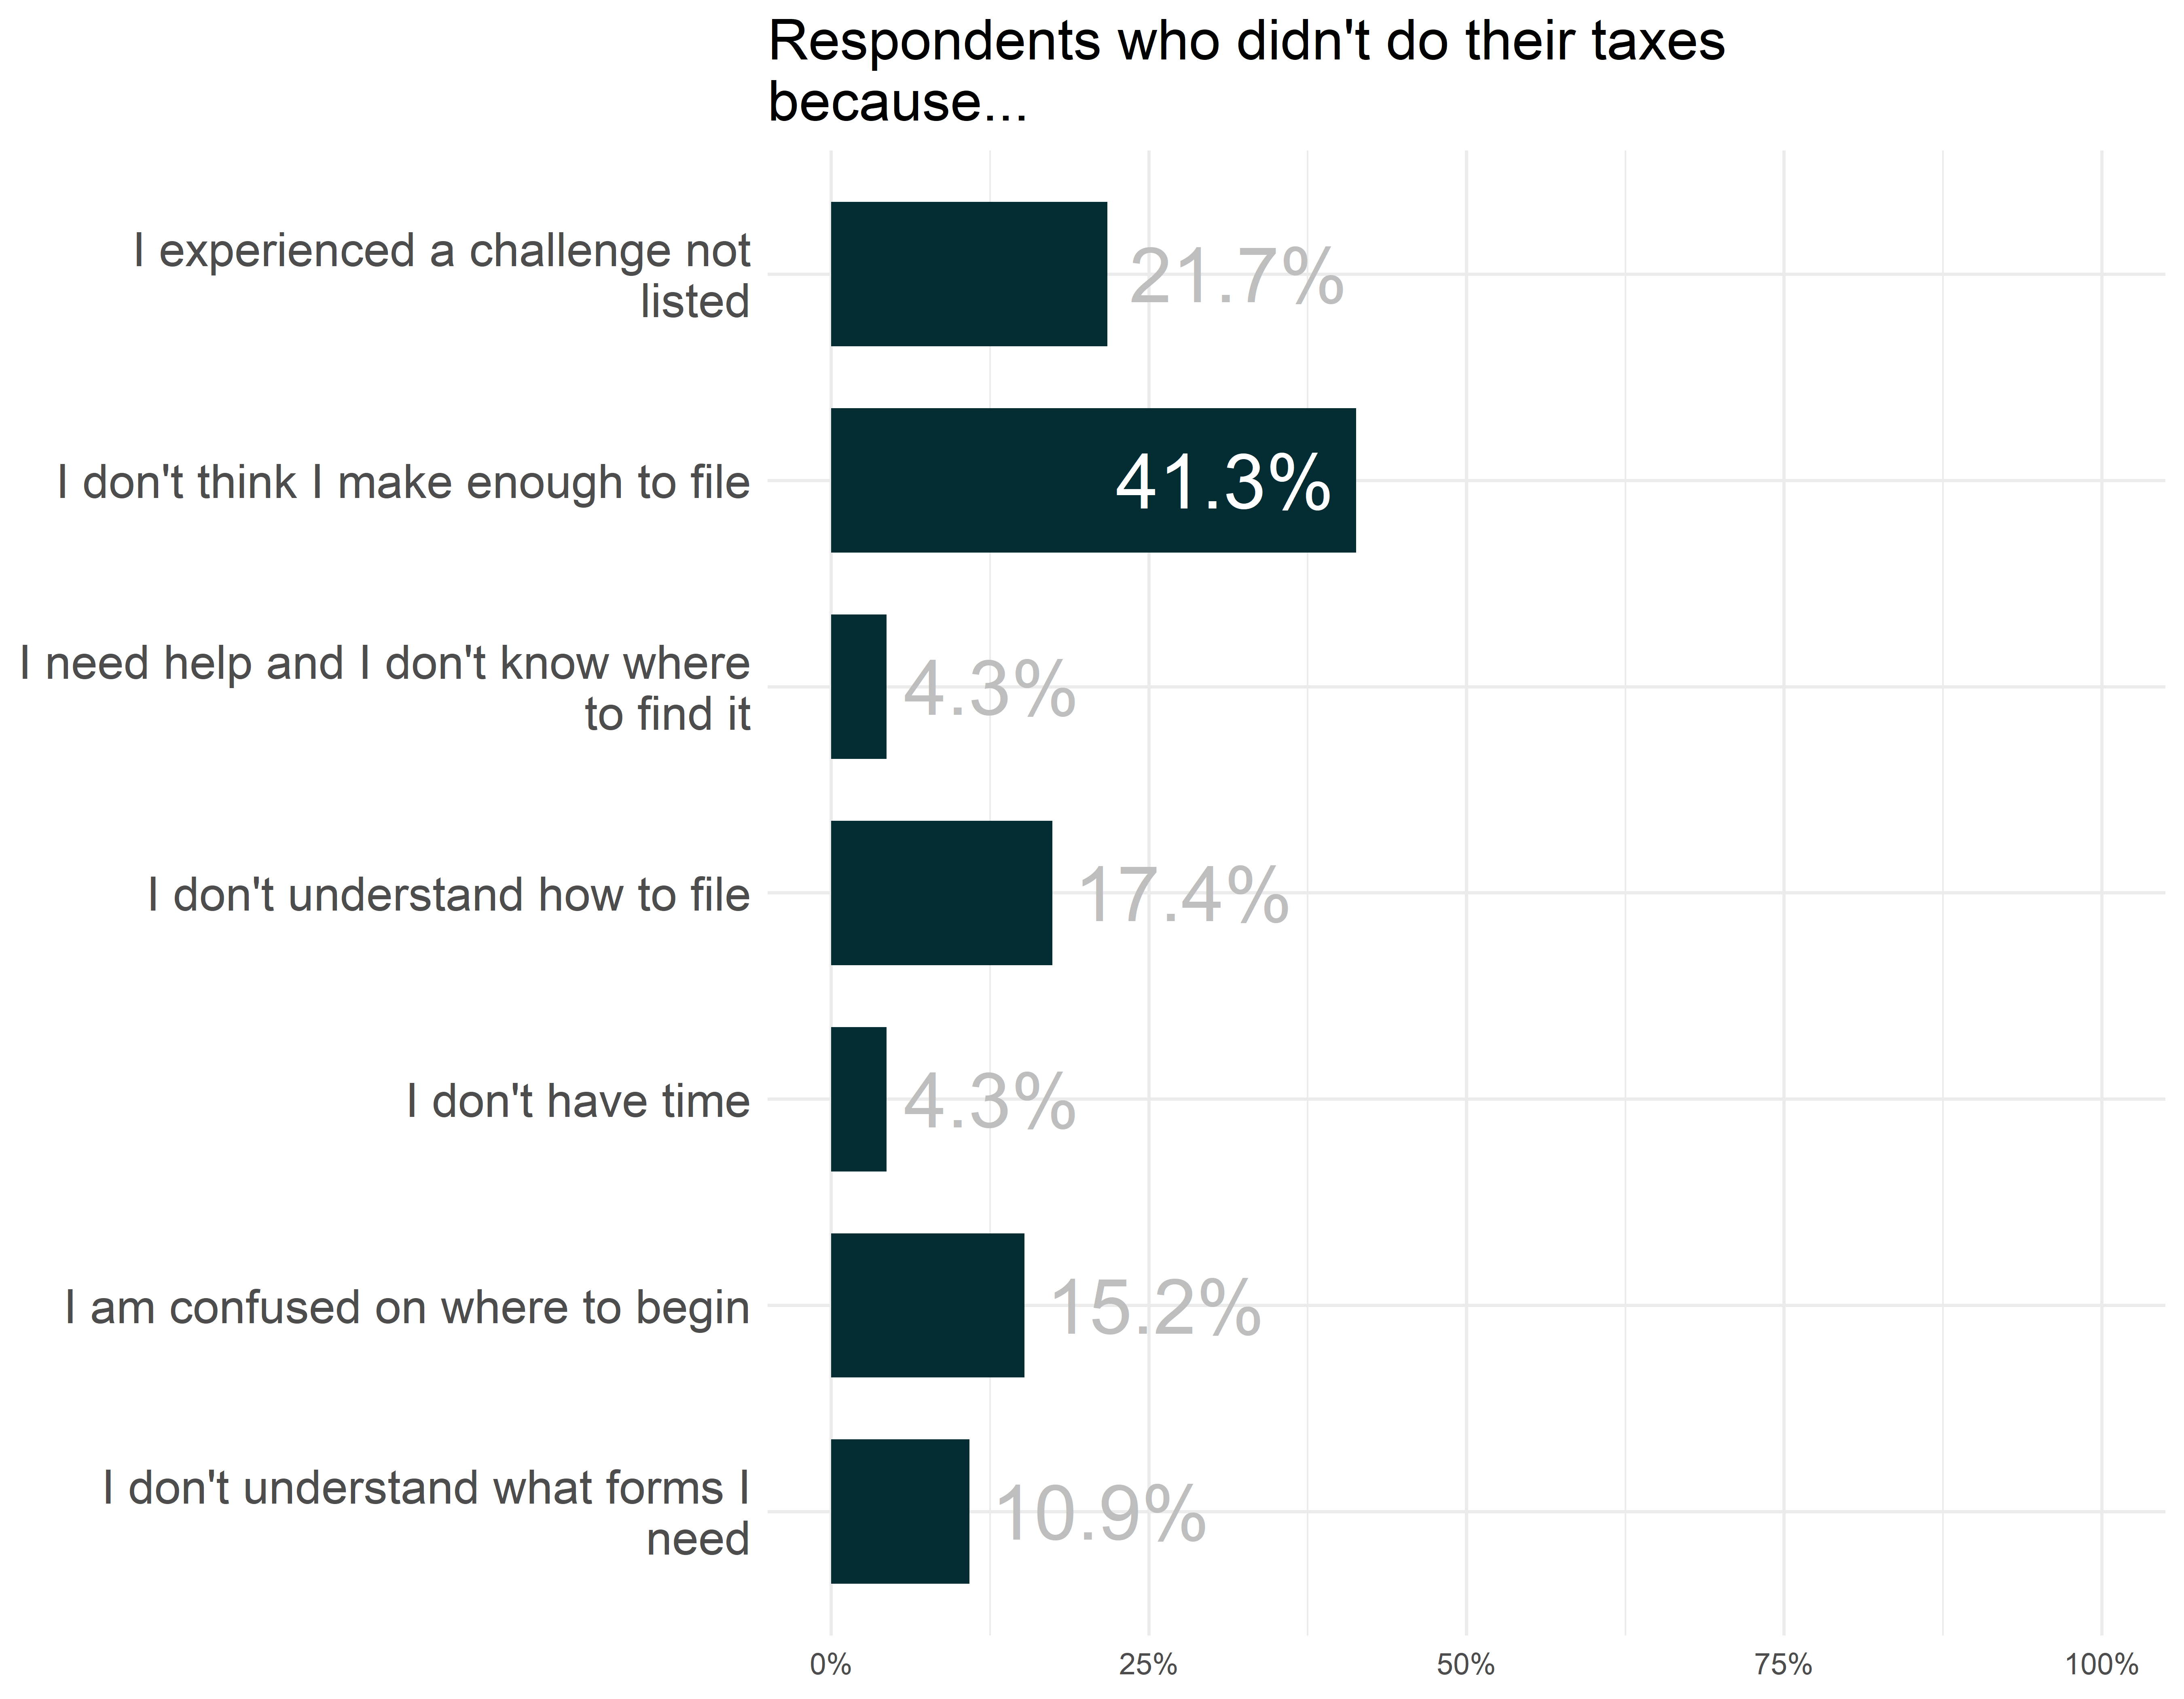
Did you file your taxes in 2023 (for the income year 2022)?
Rate of response: 83.4%
Healthcare and childcare
CPAL.HEALTH.001.a
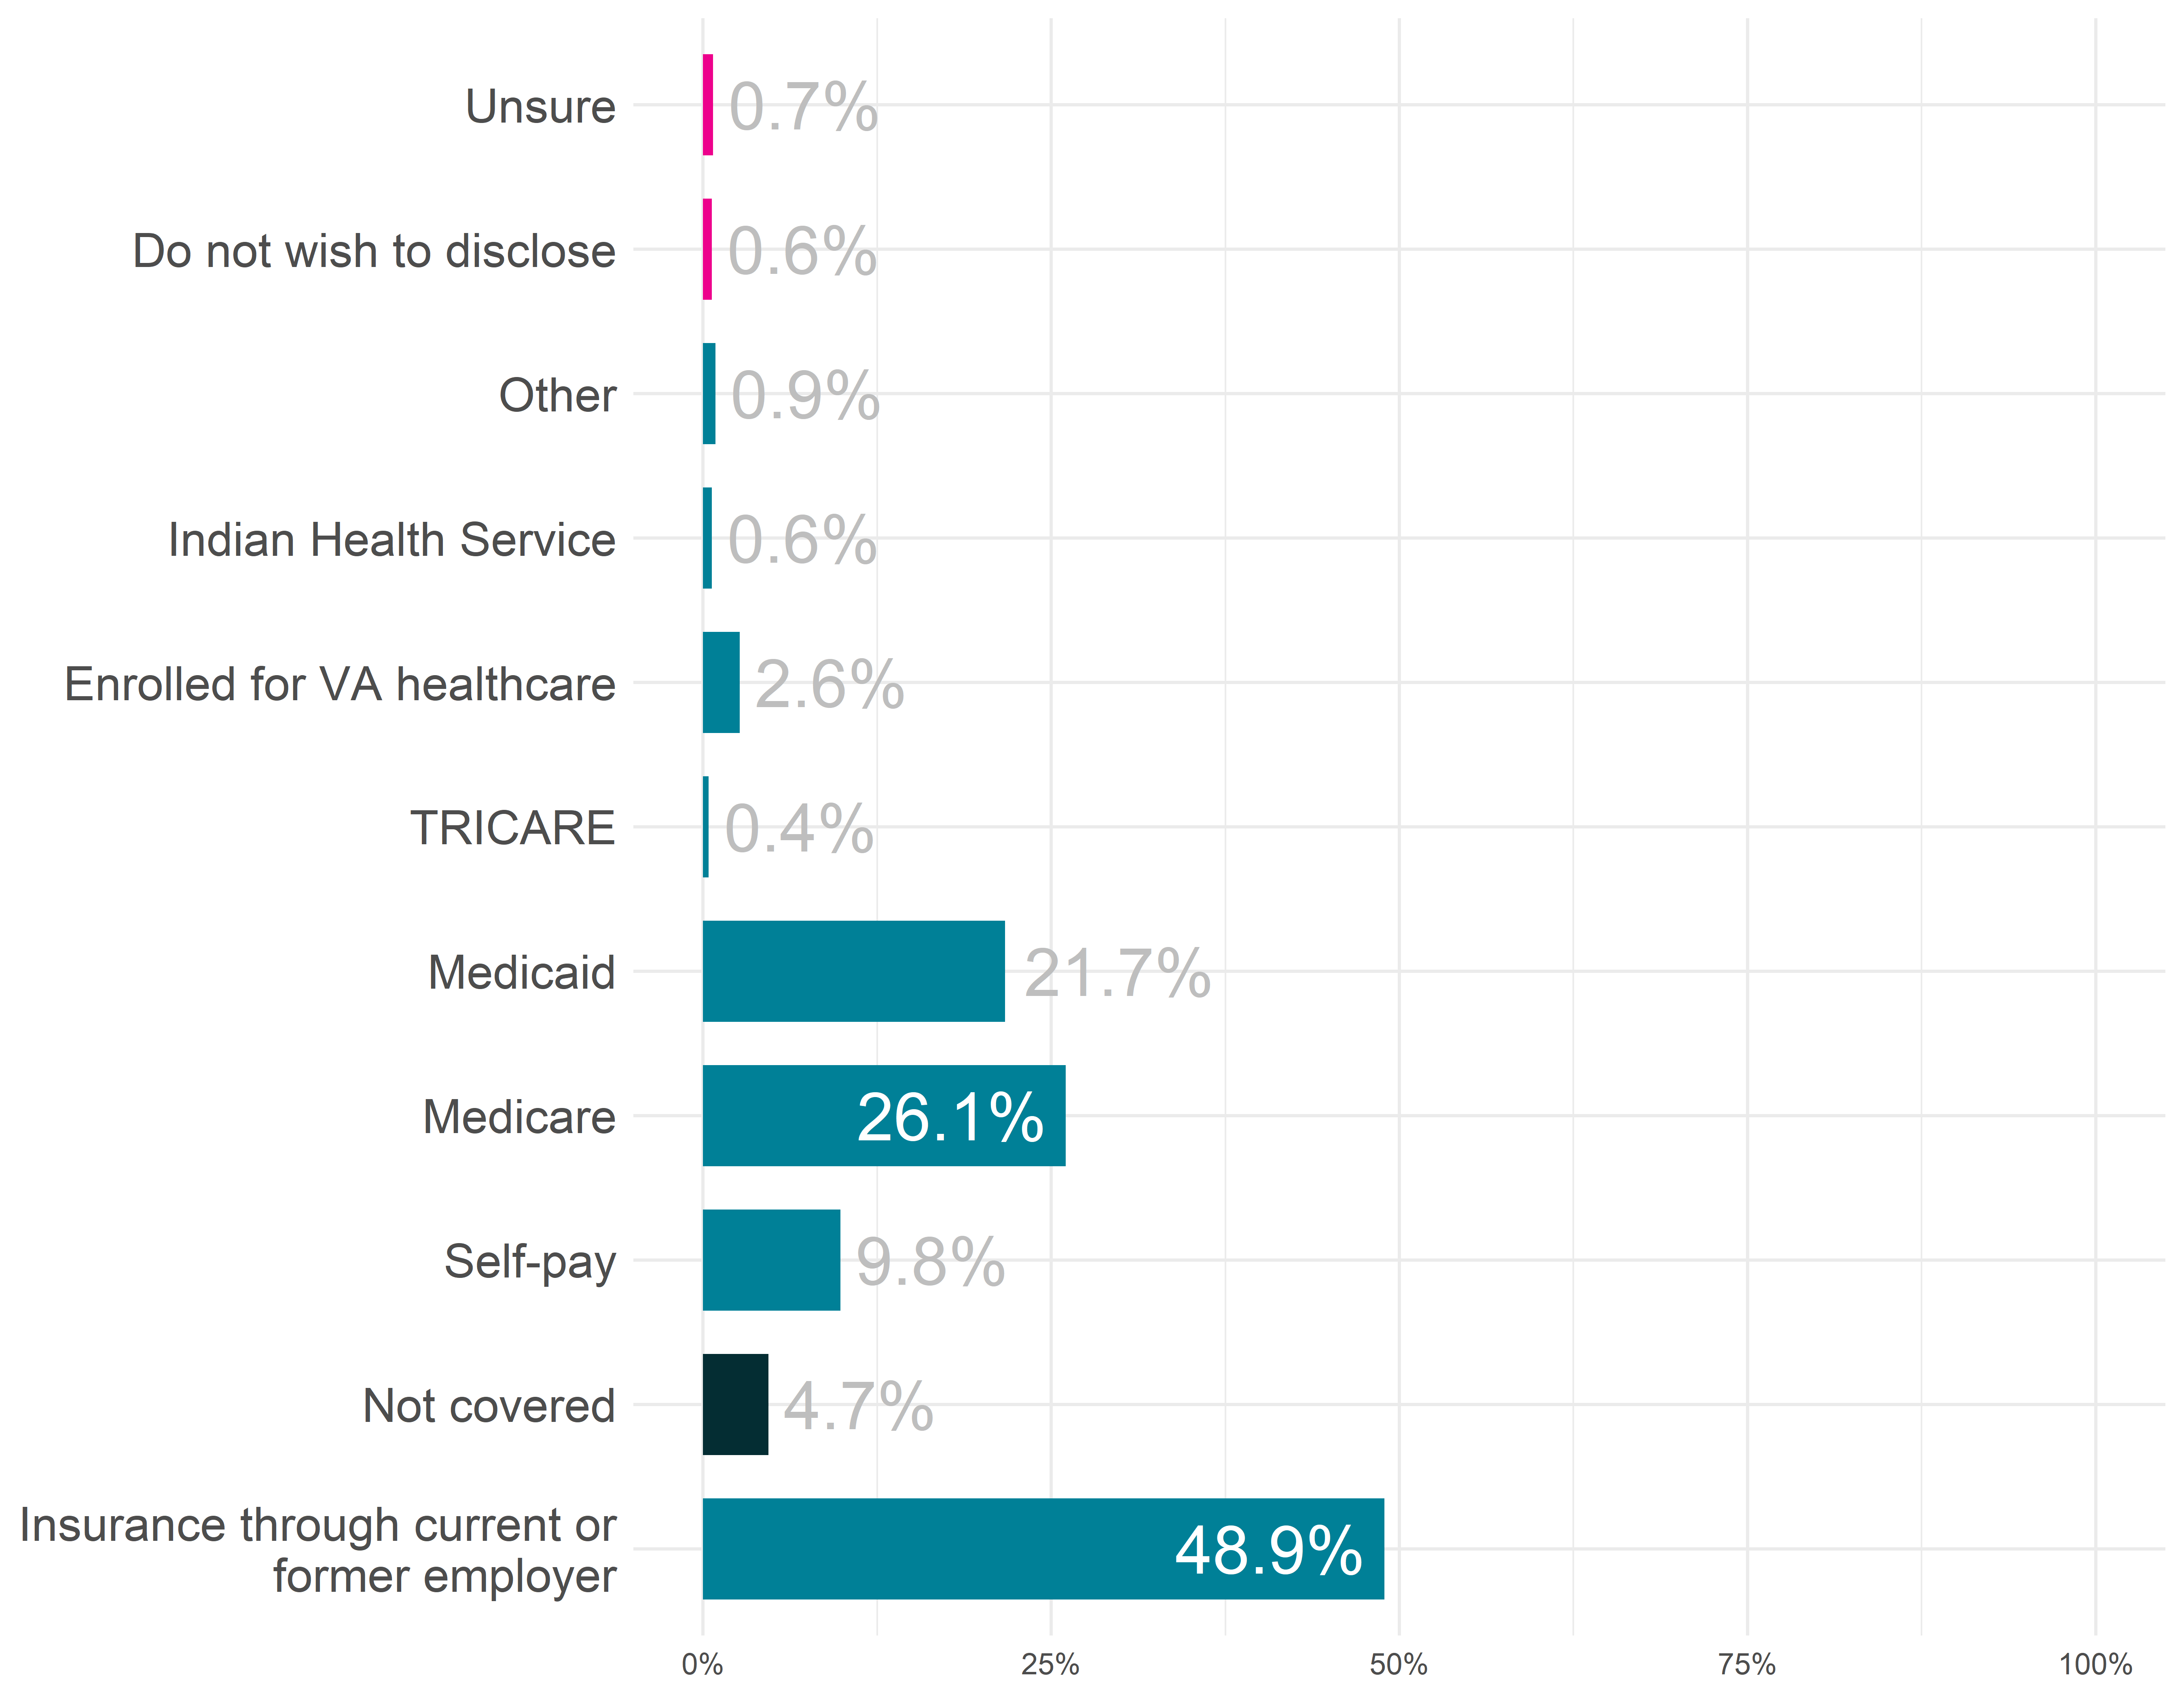
Which of the following best represents your health insurance coverage?
Rate of response: 100.0%
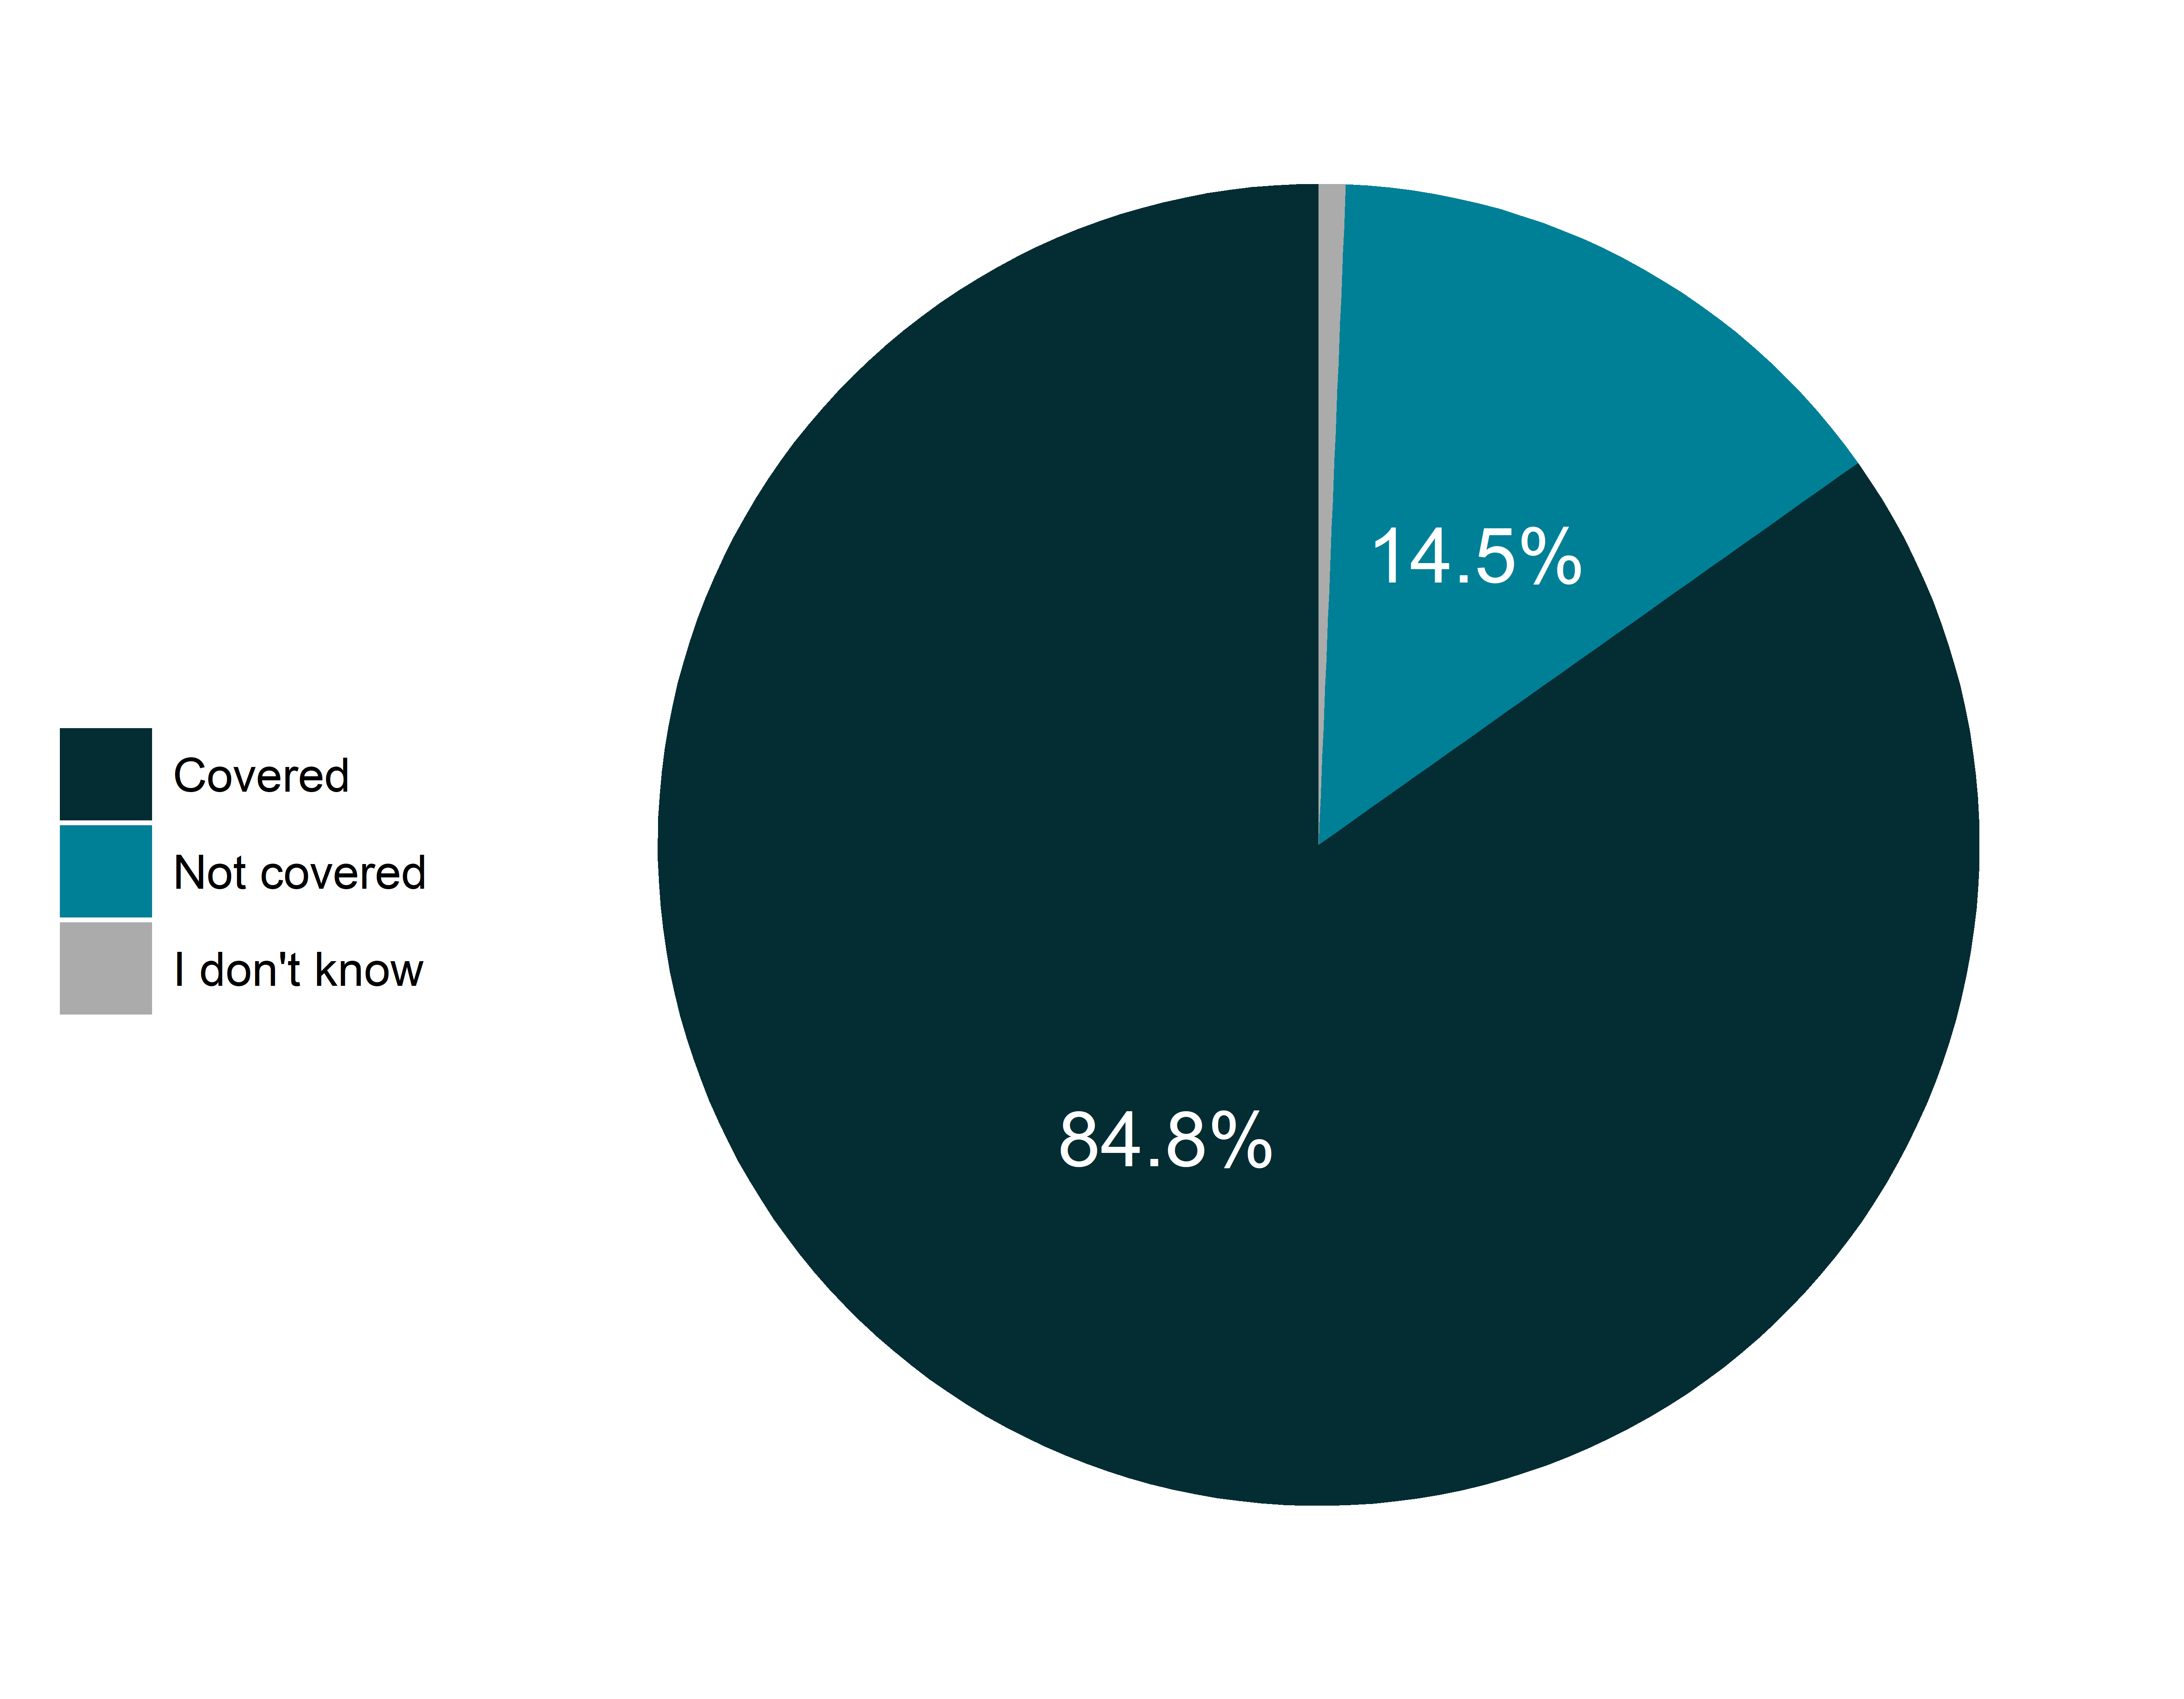
CPAL.HEALTH.002
Are your children that are between 0 and 5 years of age covered by any kind of health insurance?
Rate of response: 99.5%
CPAL.HEALTH.003.2
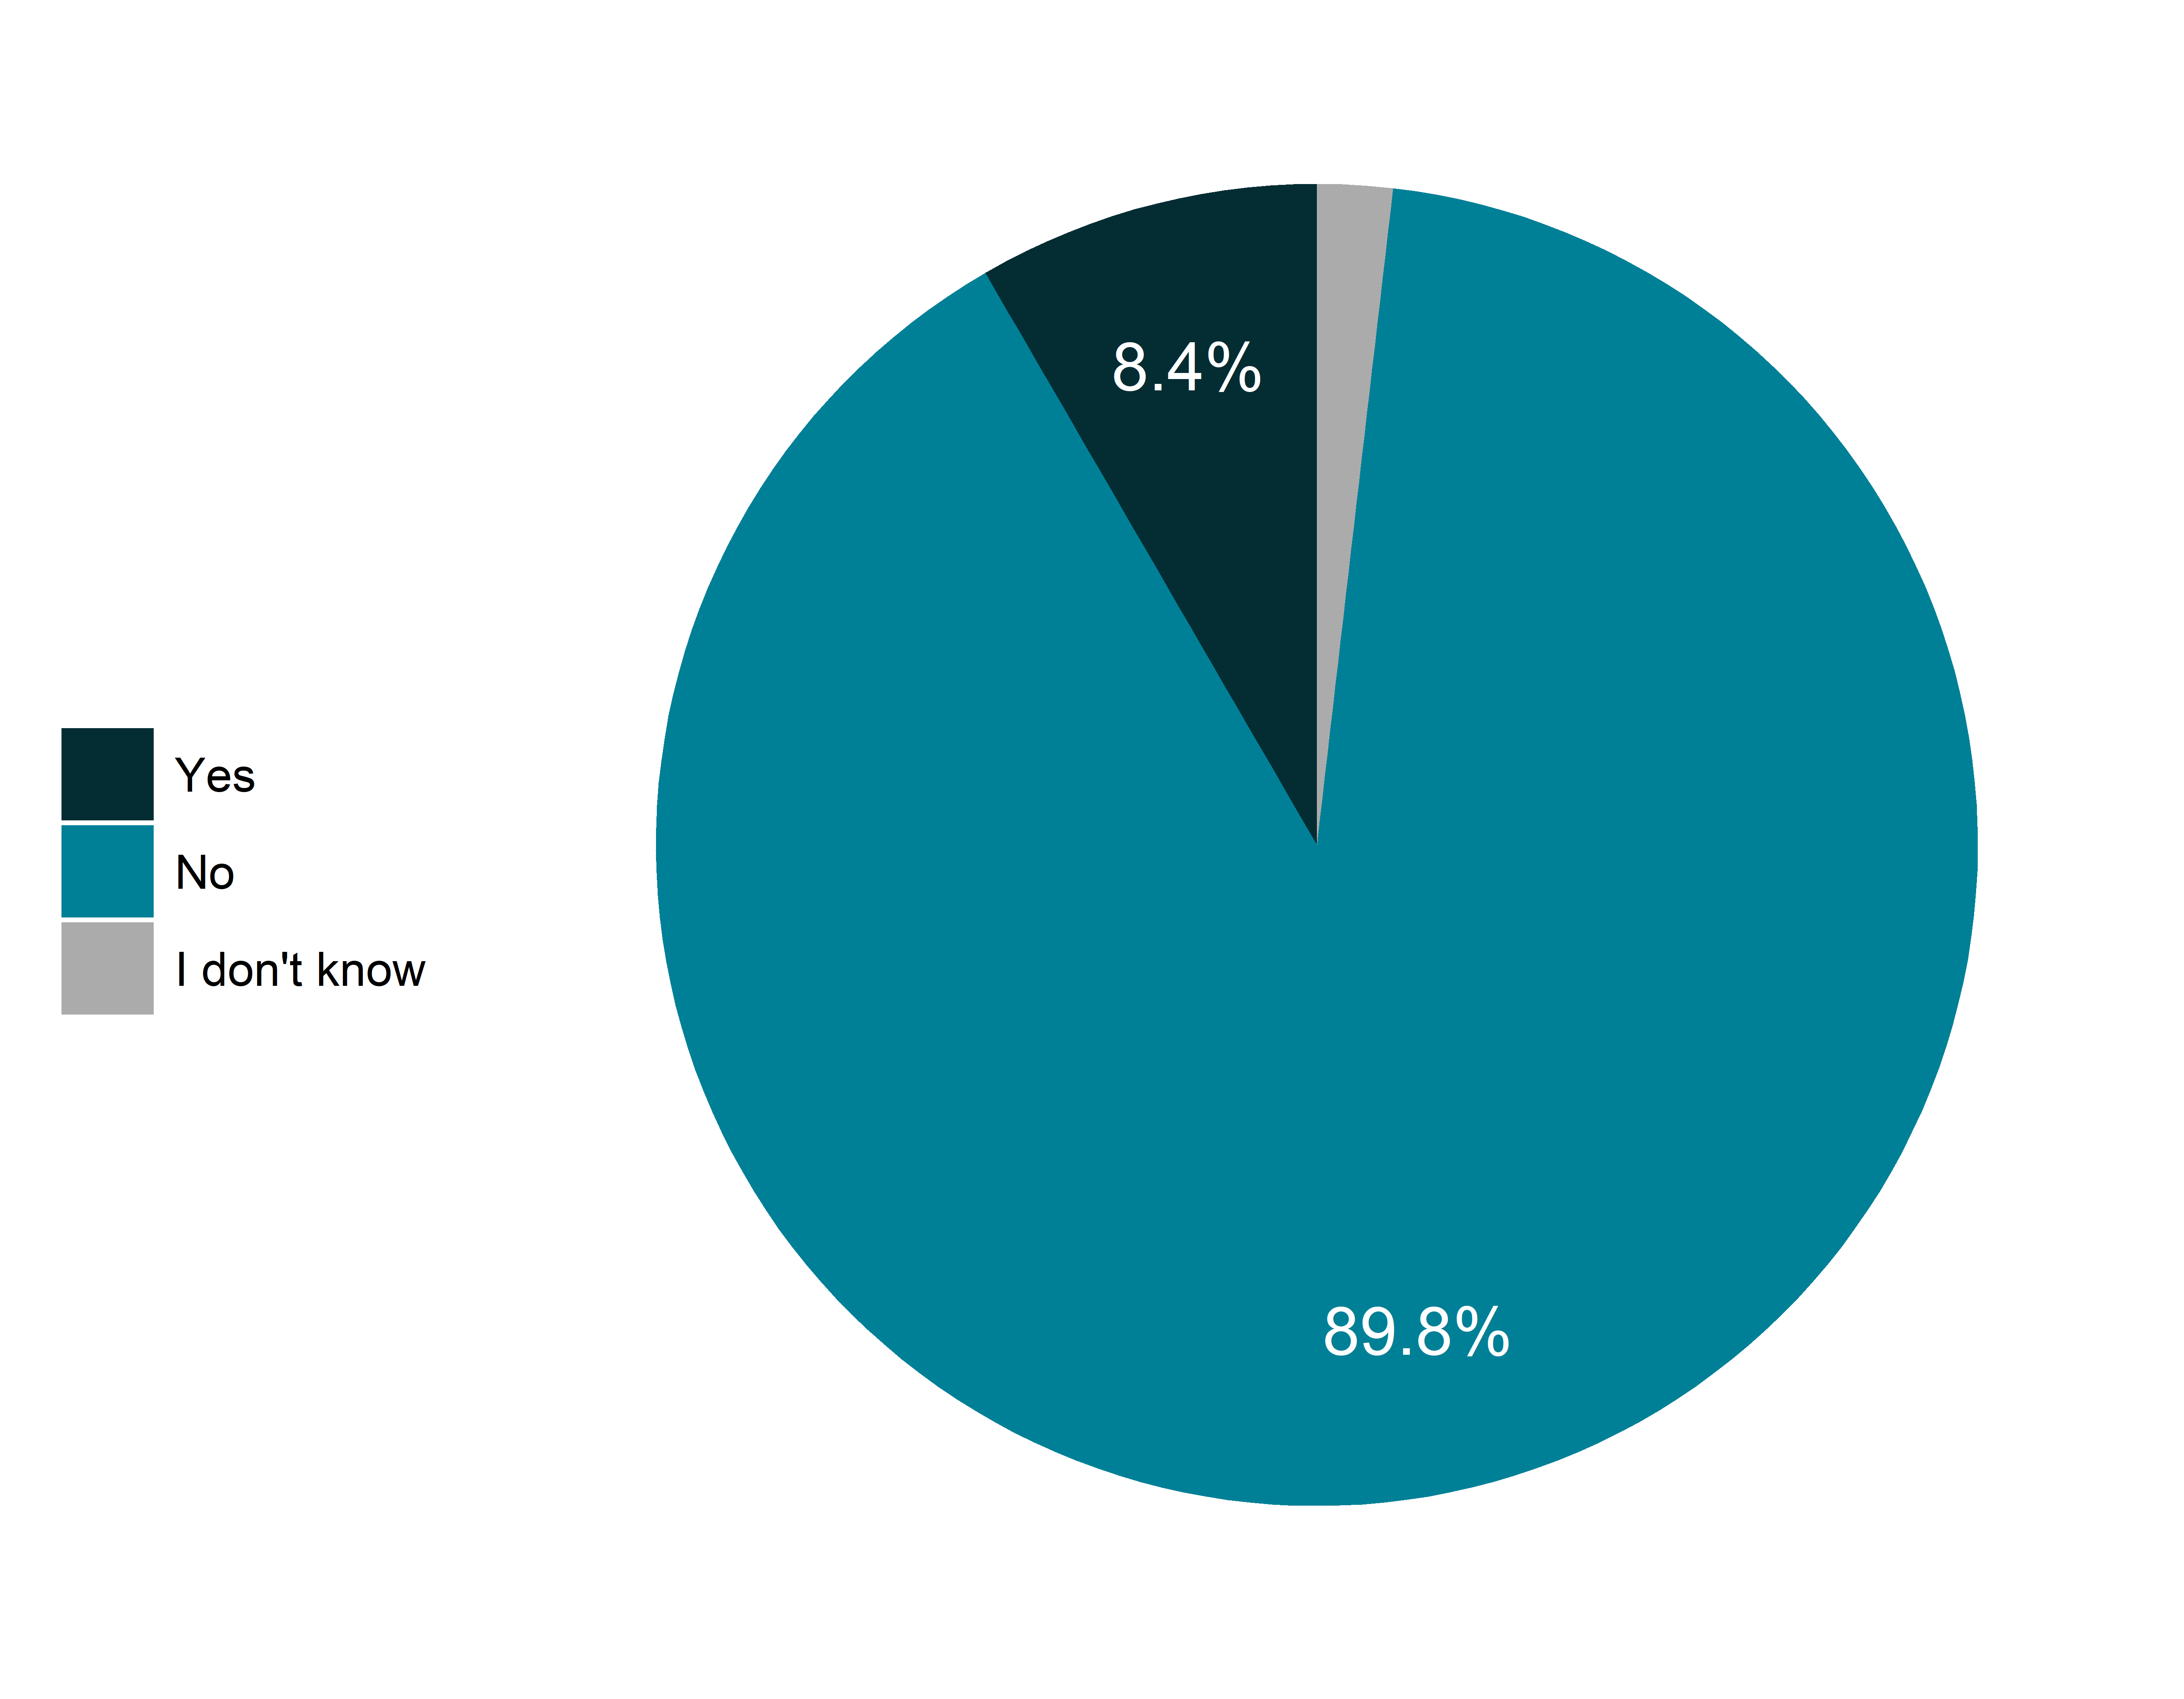
At any time in the last month, did you DELAY getting medical care (including physical or mental health visits)?
Rate of response (if applicable): 96.9%
CPAL.POLICY.035
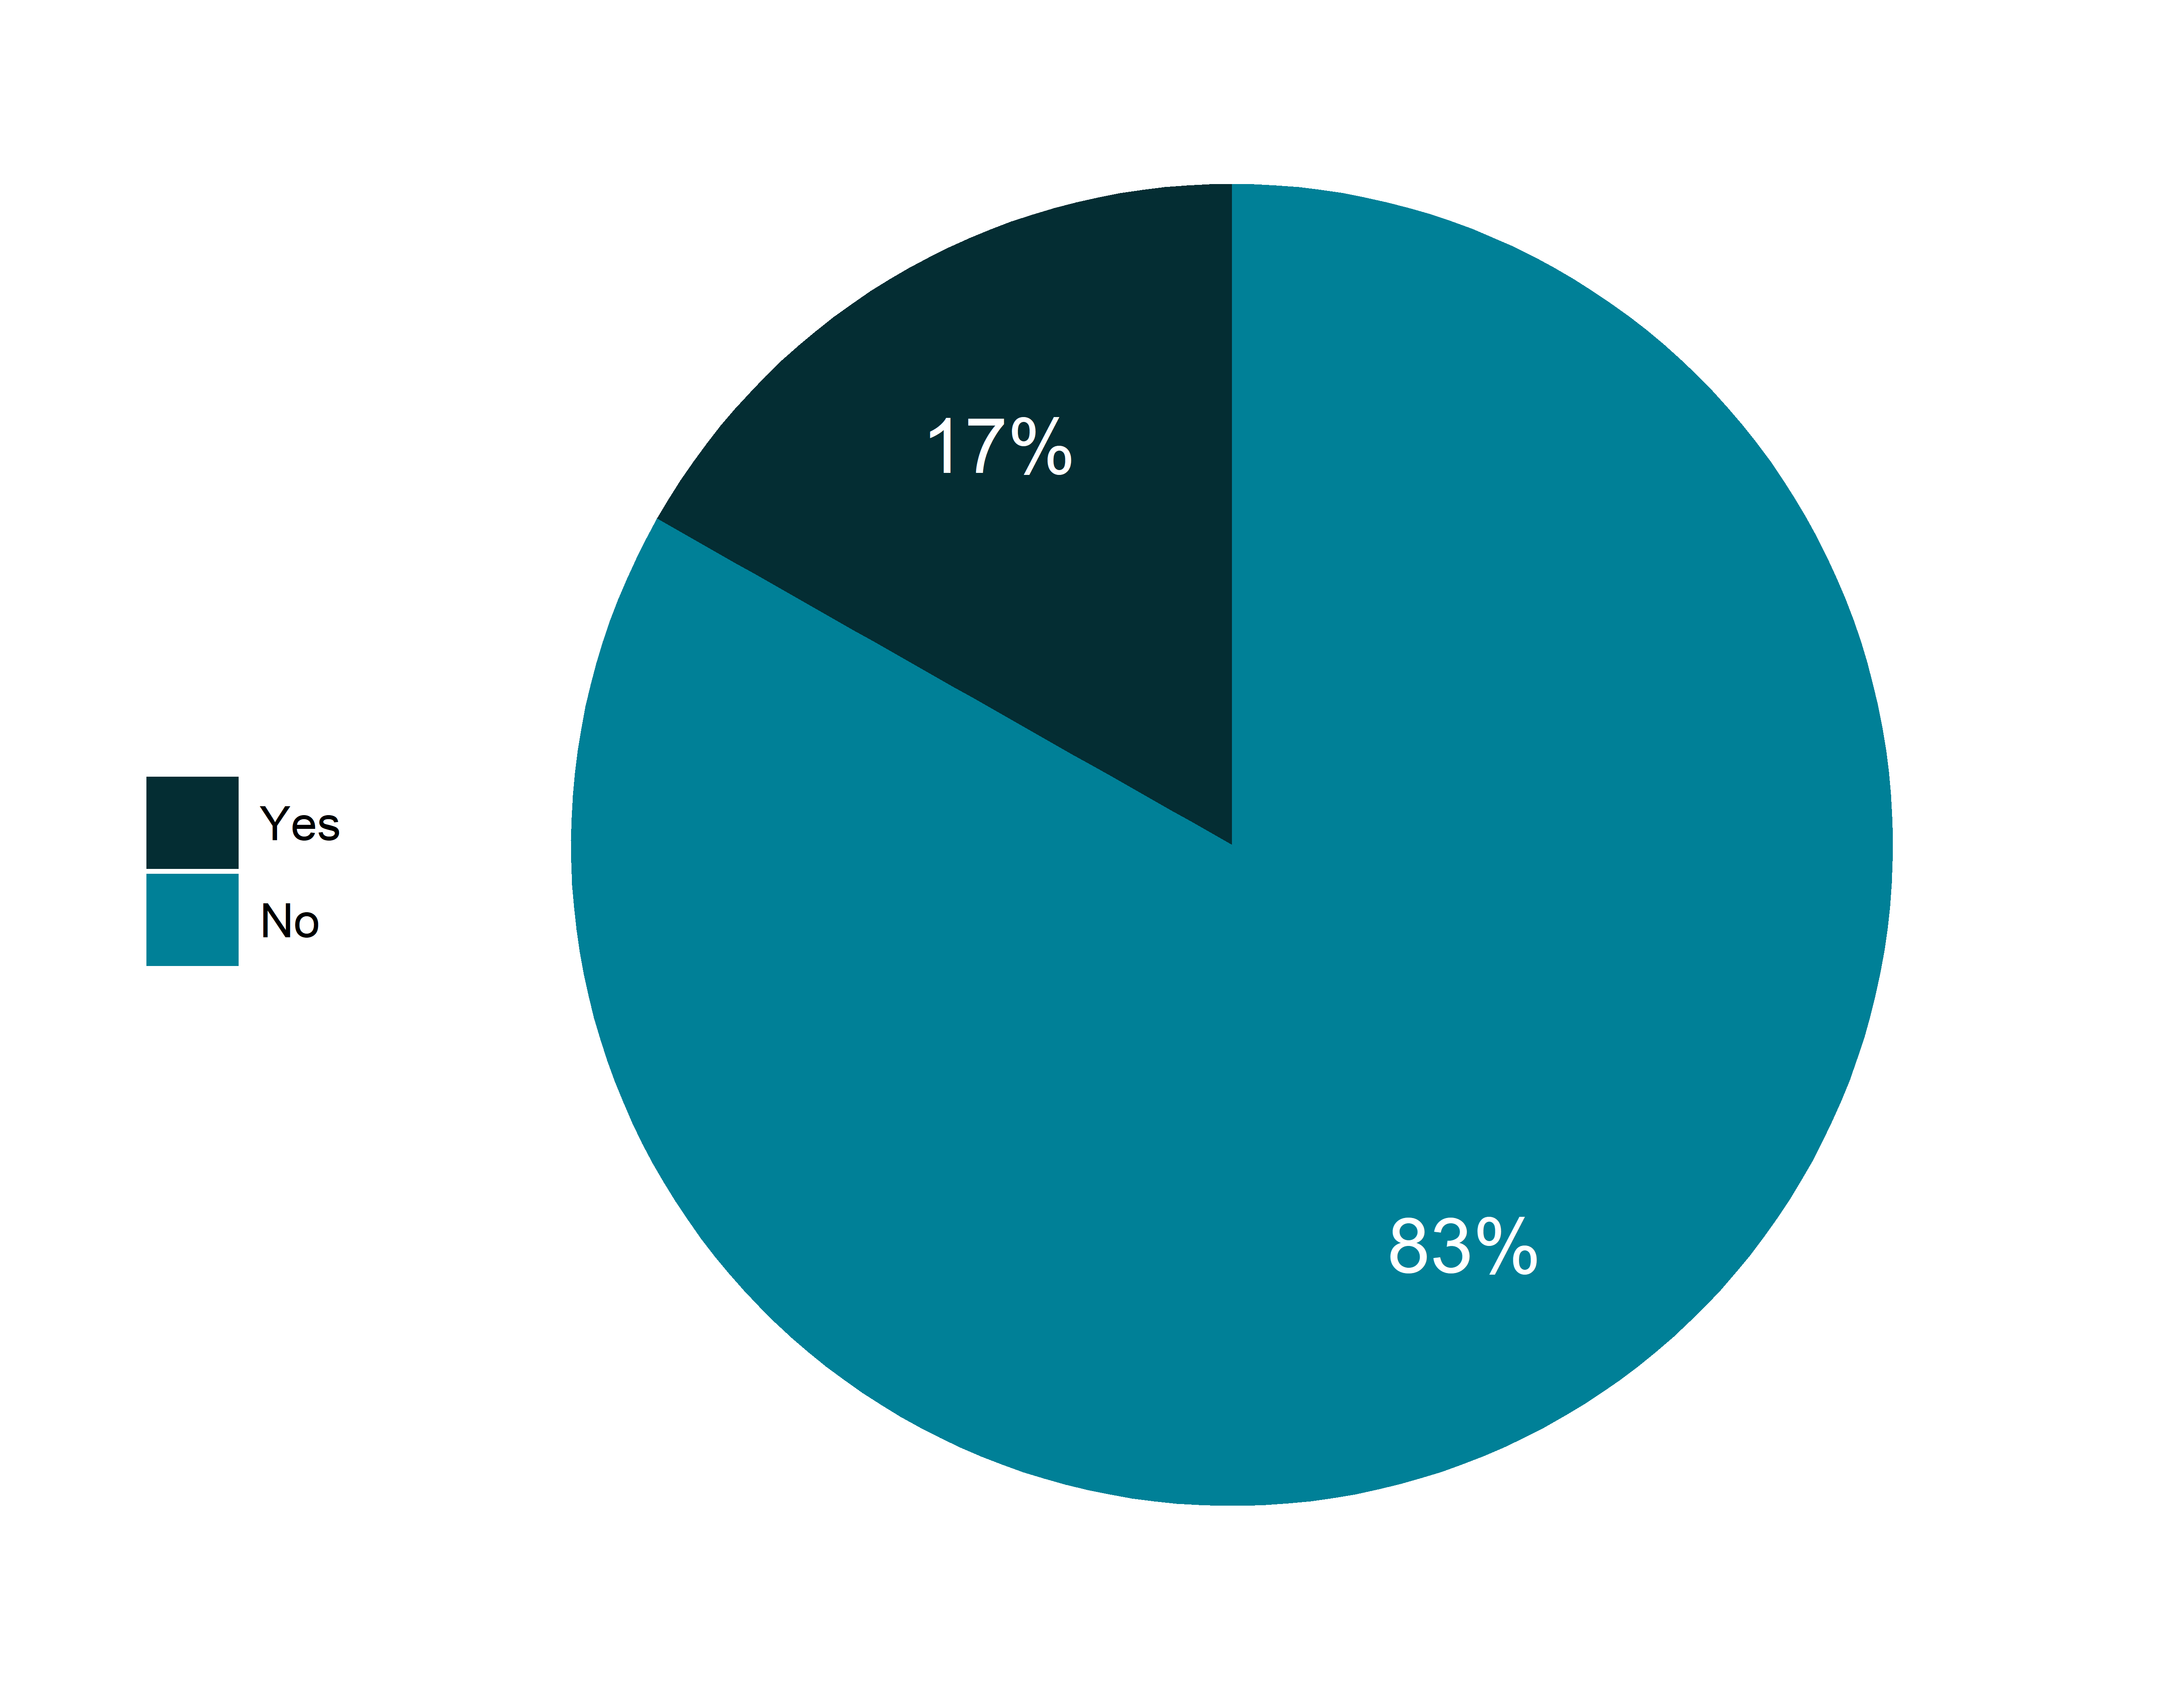
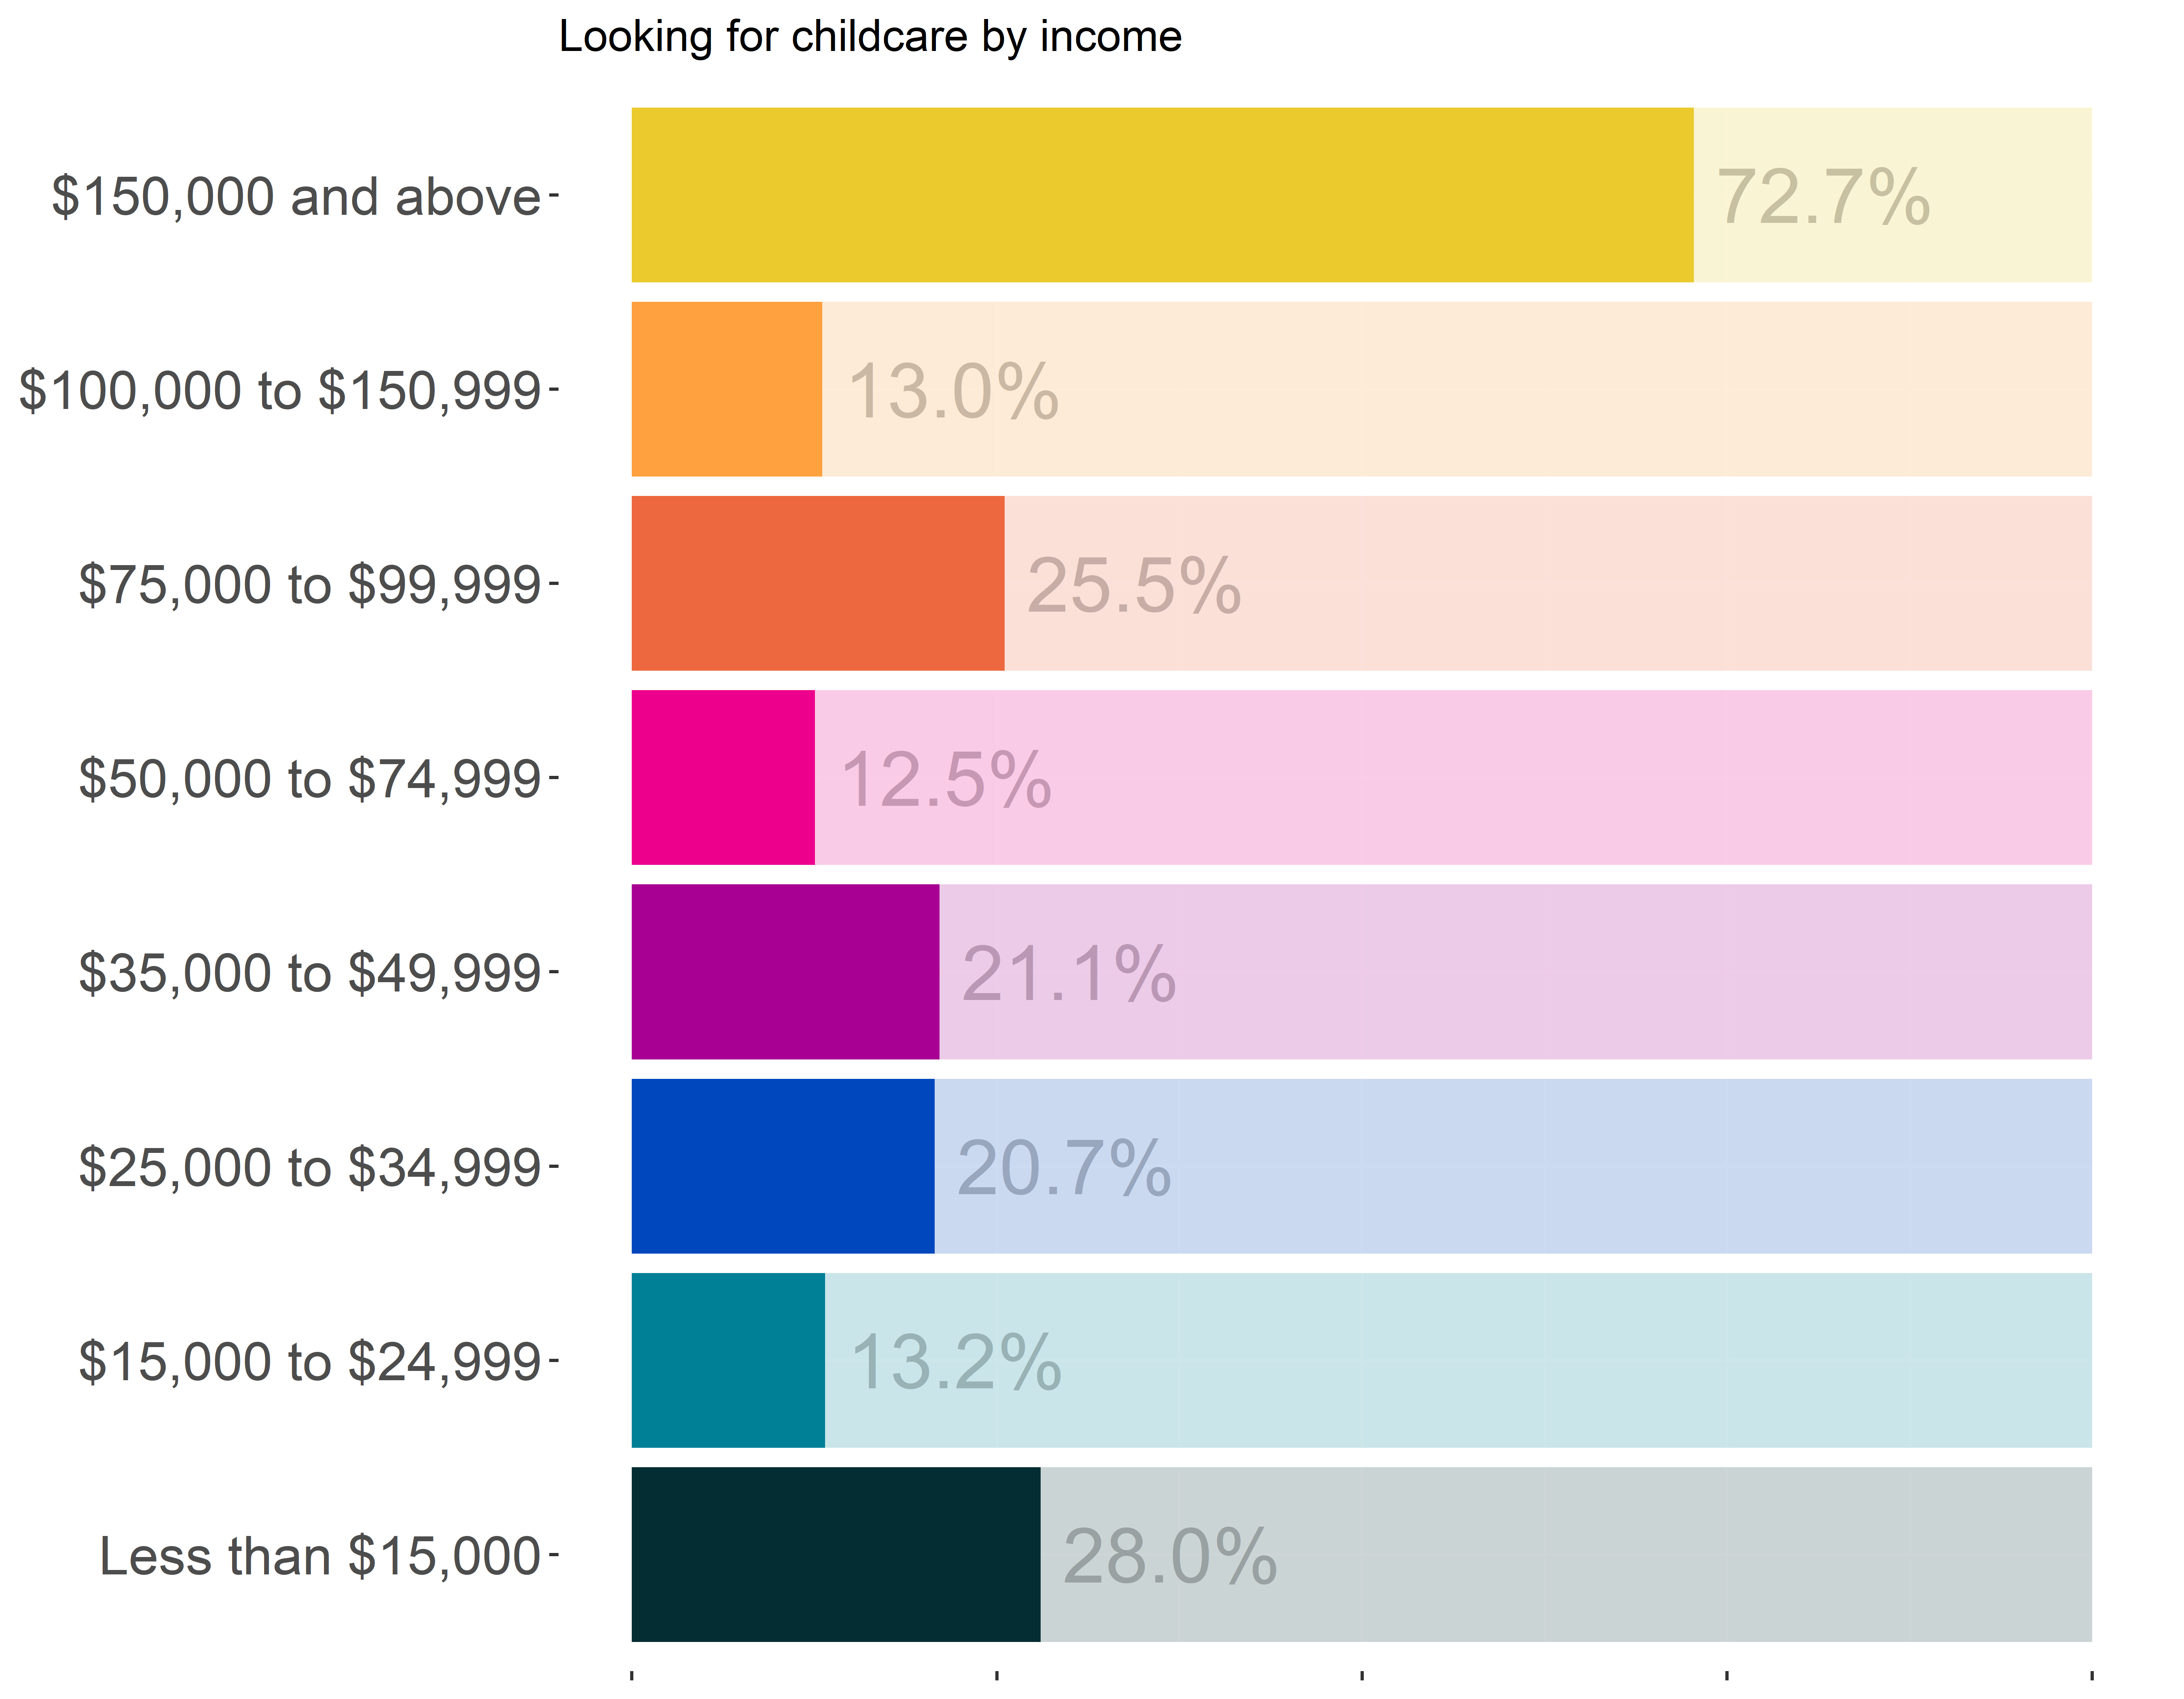
Are you currently looking for childcare?
Rate of response: 90.9%
CPAL.POLICY.037
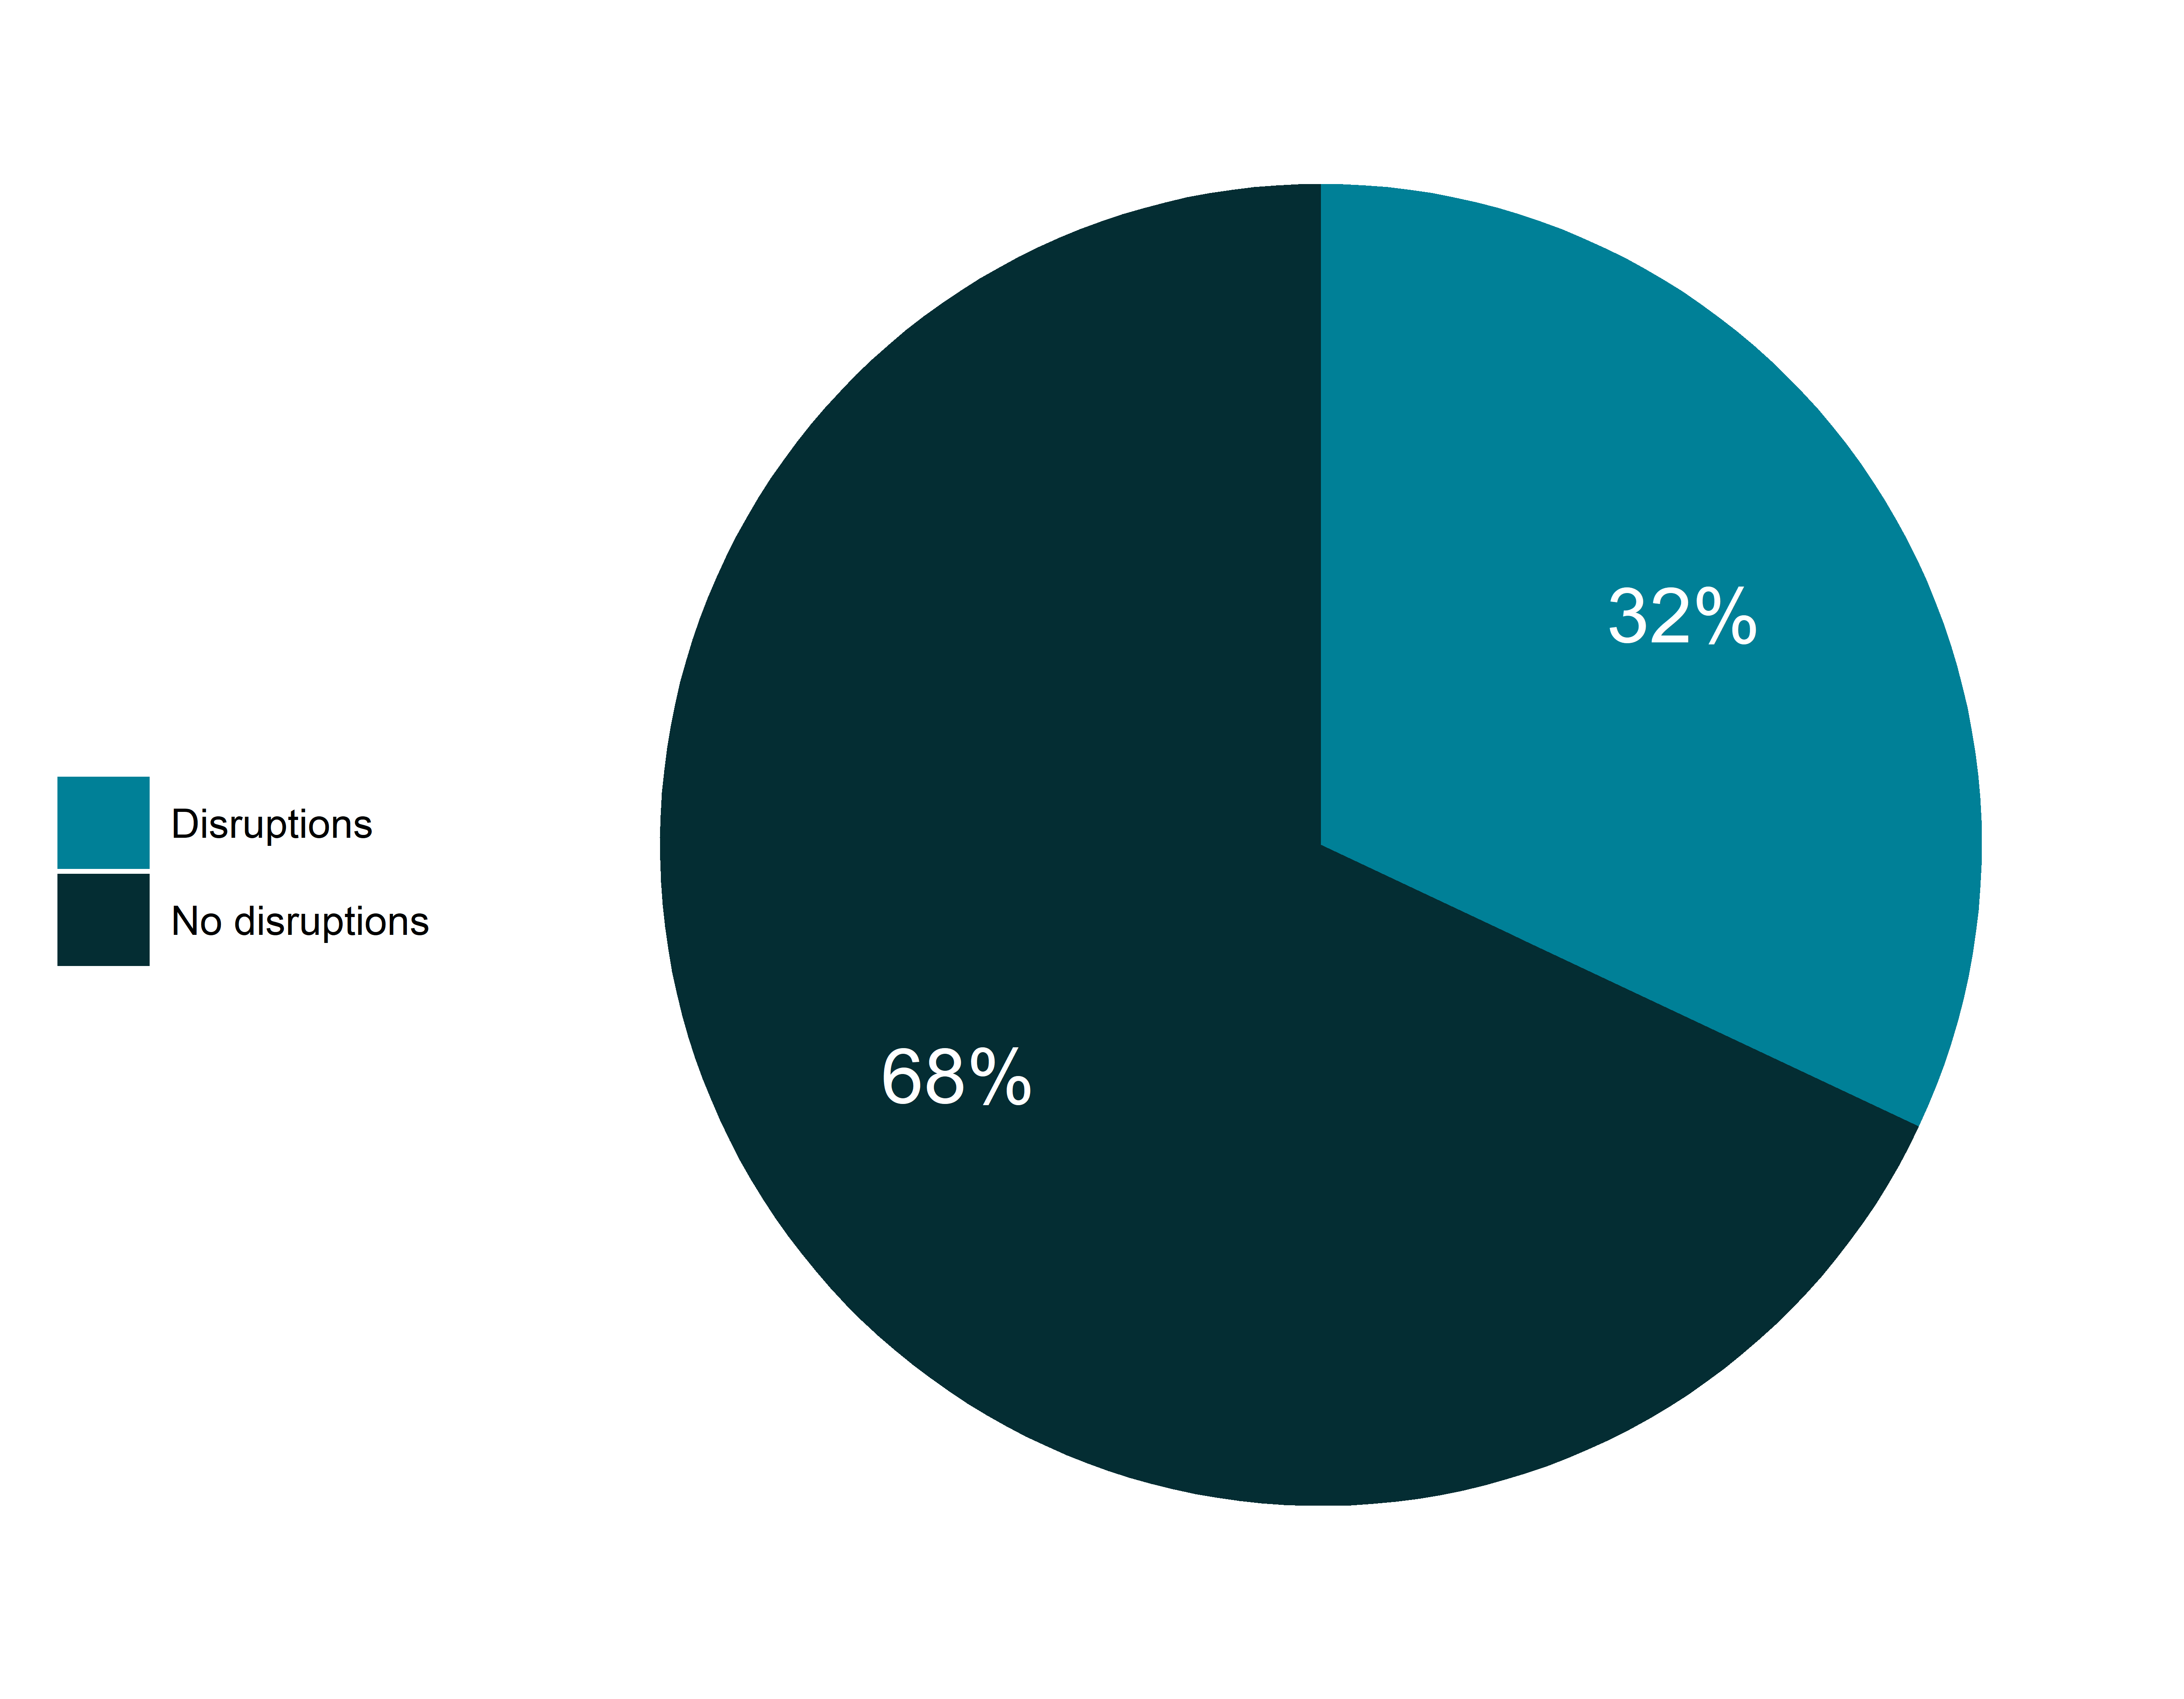
Have you experienced disruptions to your childcare in the past month?
Rate of response (if applicable): 2.0%
CPAL.POLICY.016
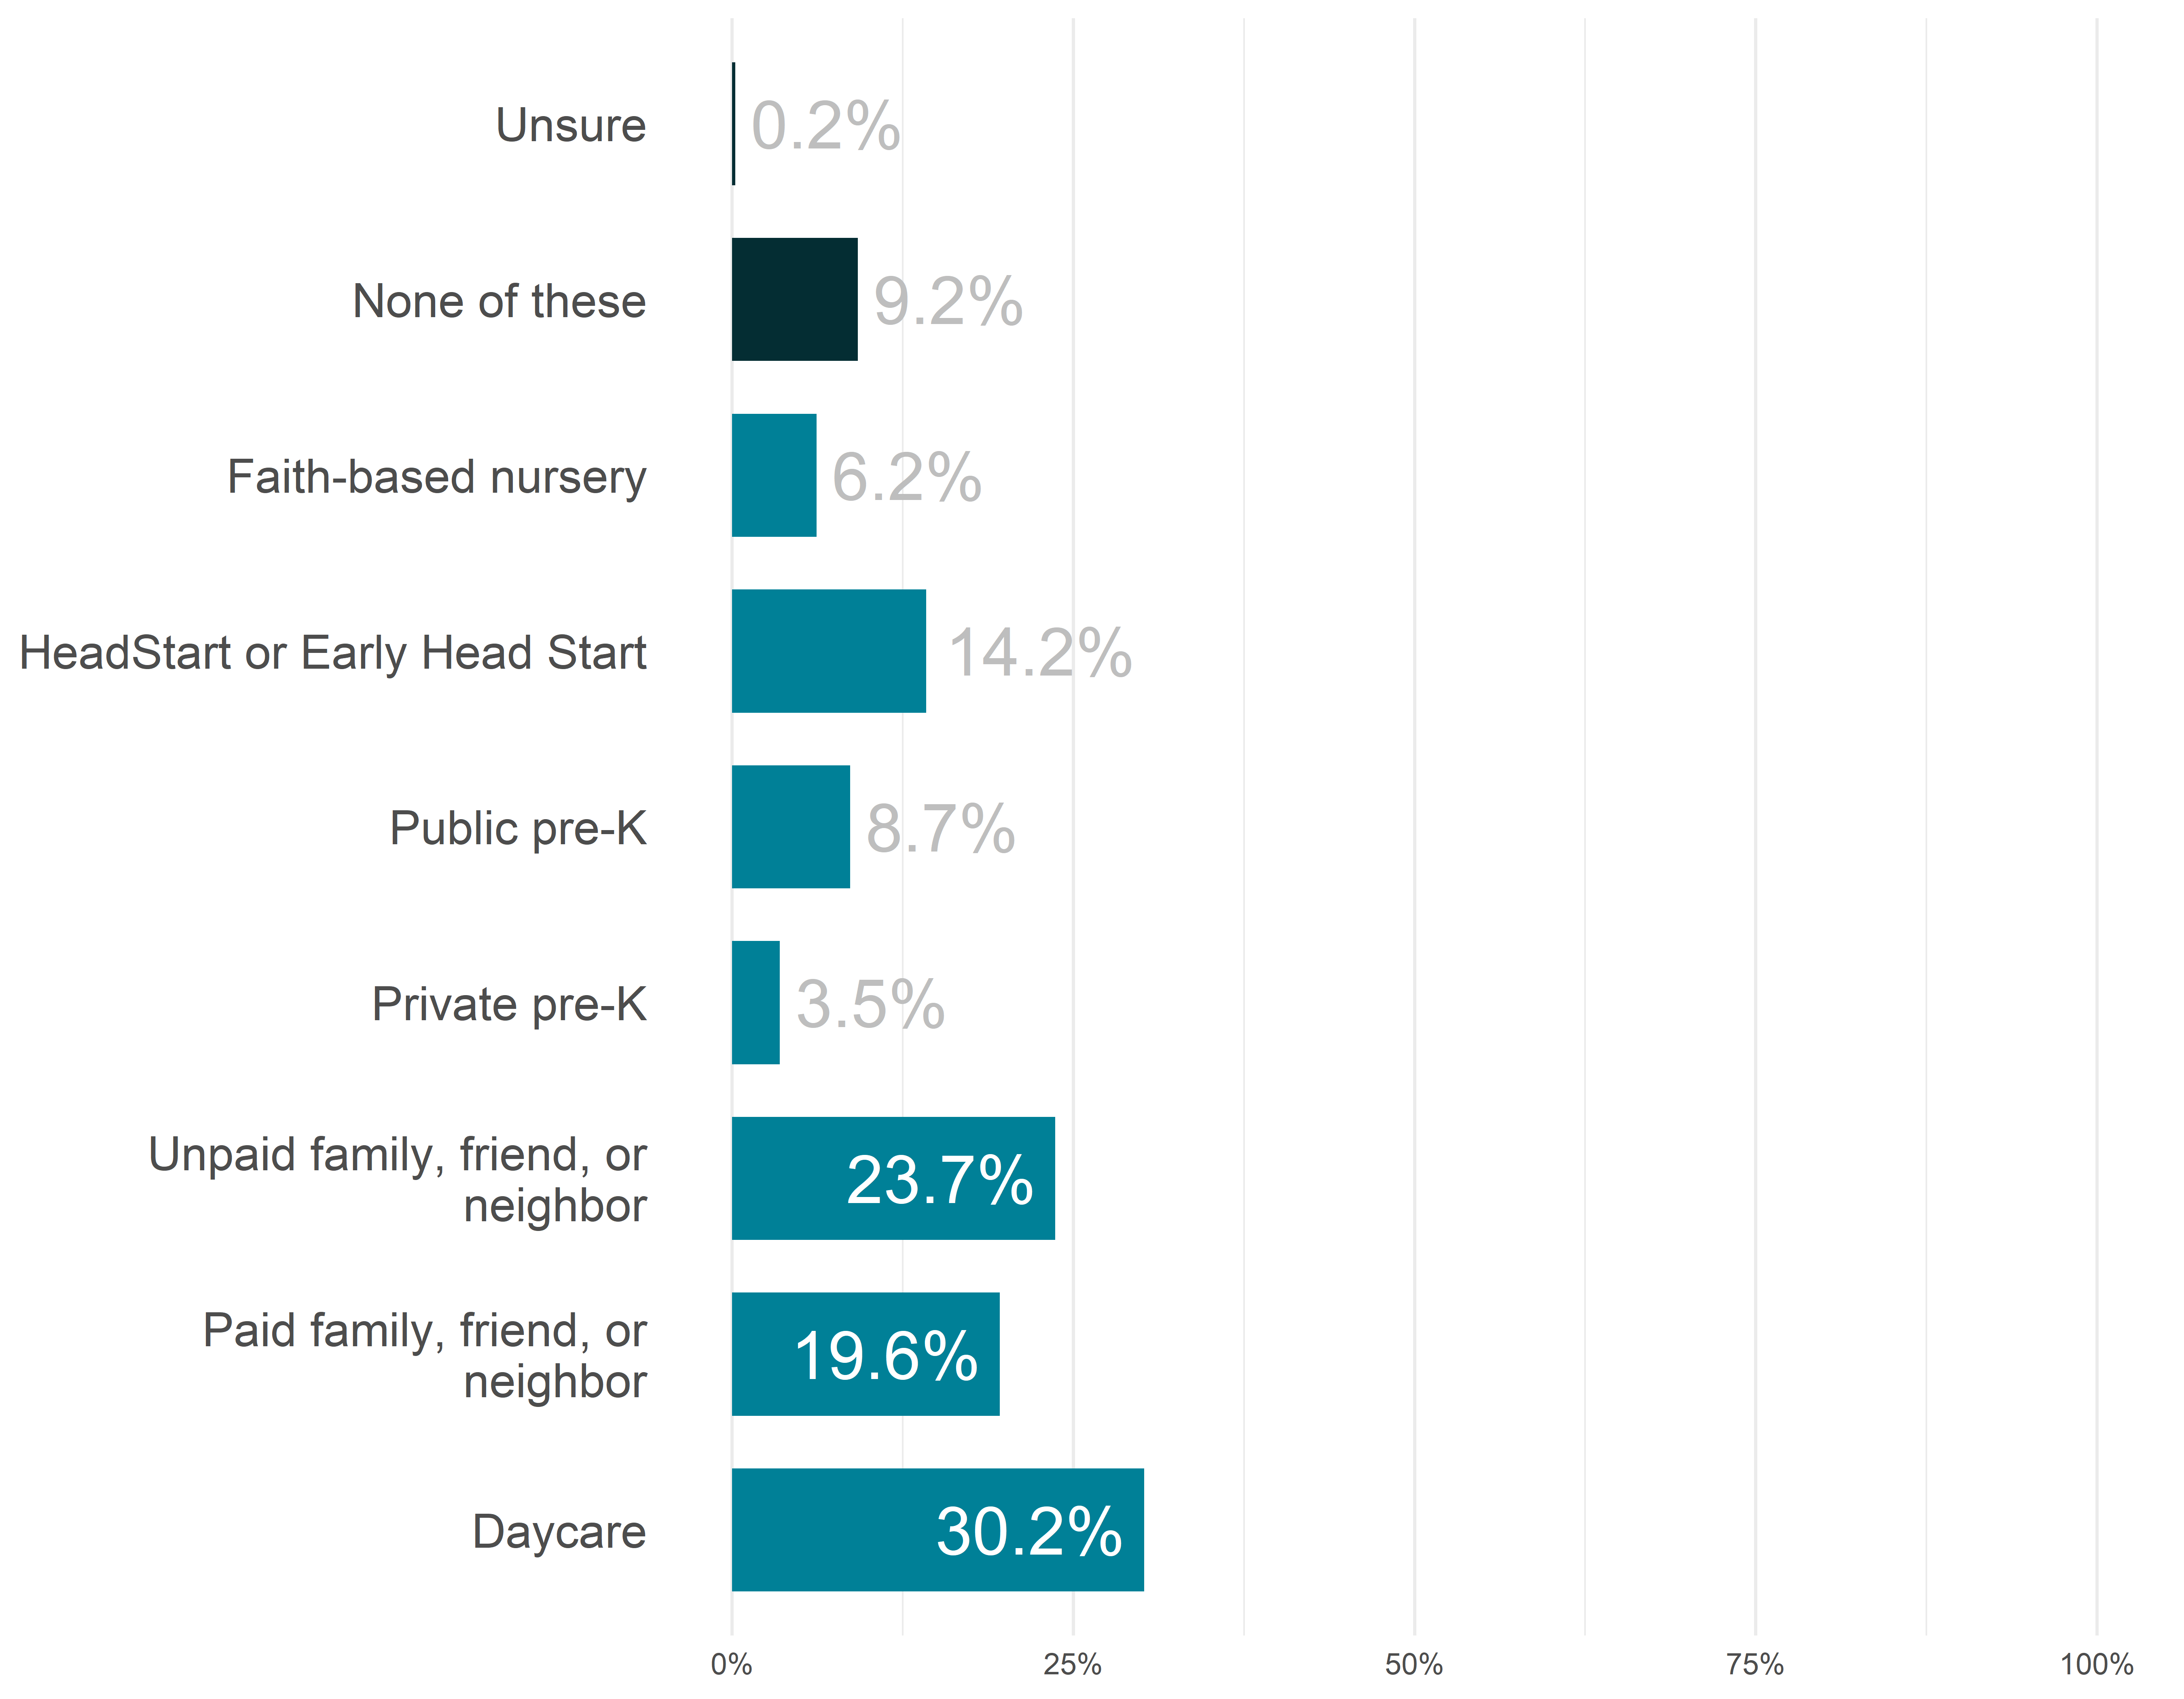
Currently, which of the following types of childcare do you use for your child(ren) under age 6 for at least 5 hours per week?
Rate of response: 100.0%
CPAL.HEALTH.002
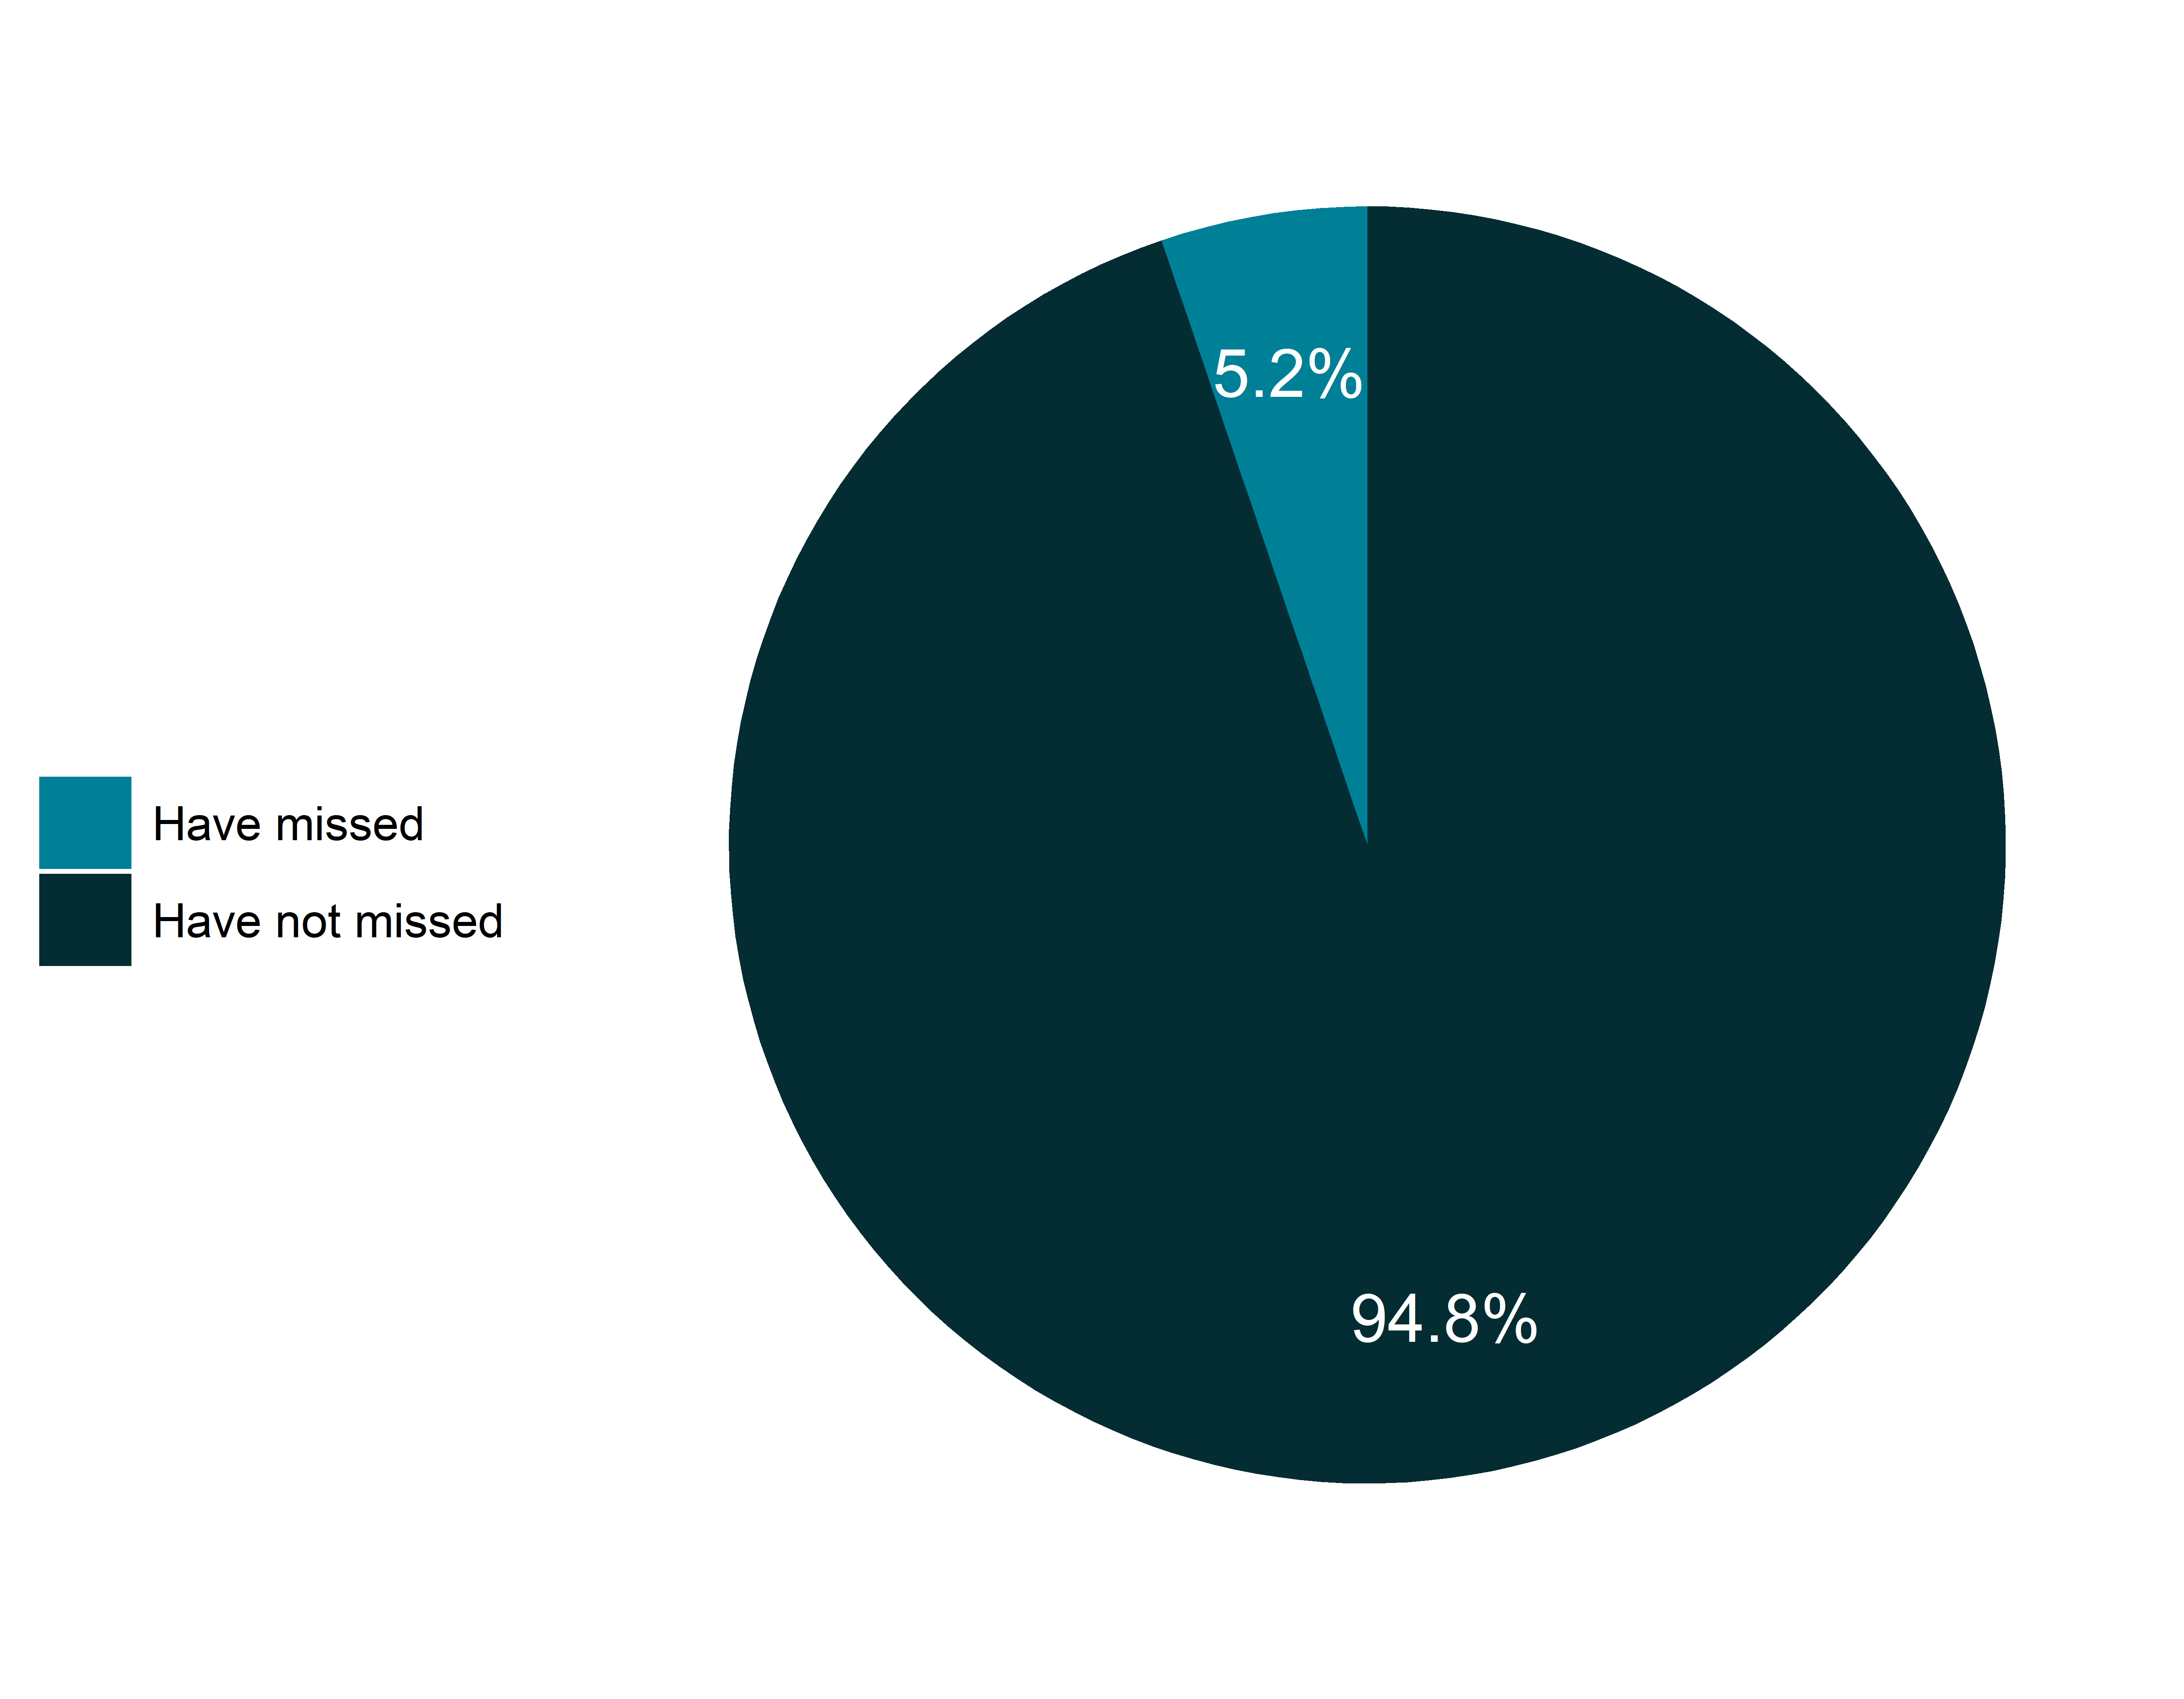
Have you missed a well baby check up in the past month?
Rate of response (if applicable): 97.5%
Housing and home conditions
CPAL.DEBT.007
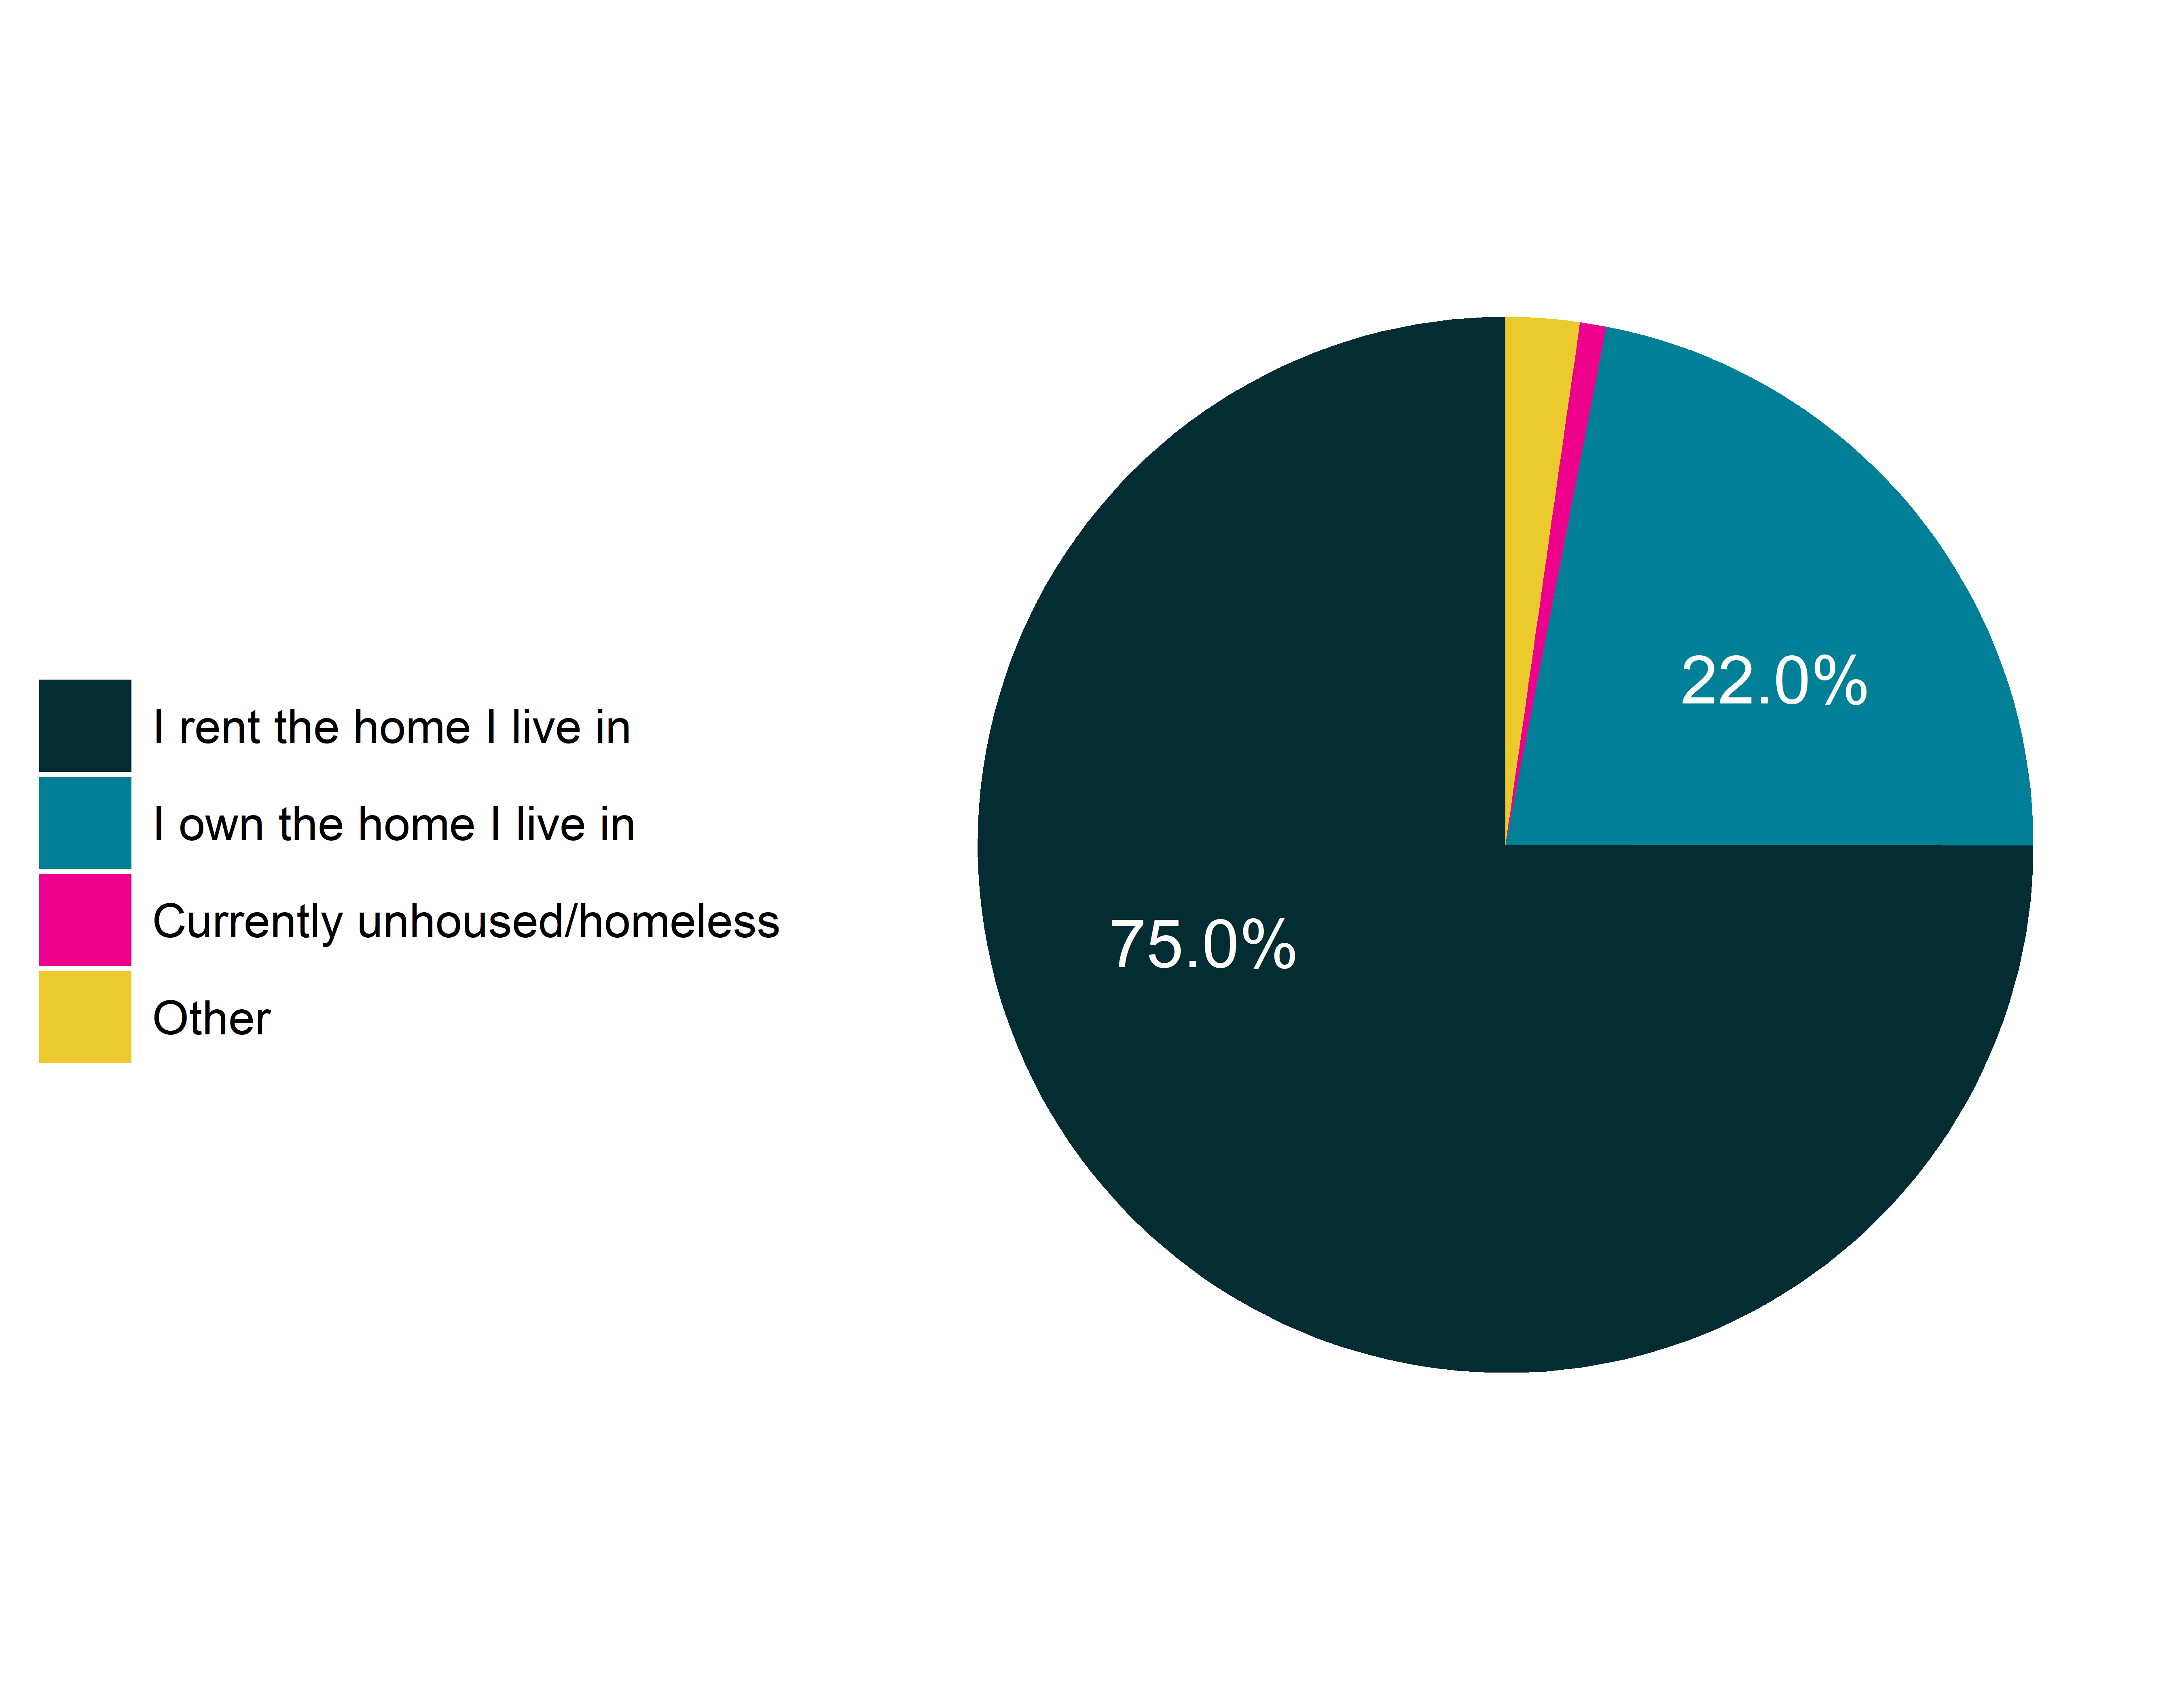
Please describe your housing status
Rate of response: 98.7%
CPAL.DEMO.011
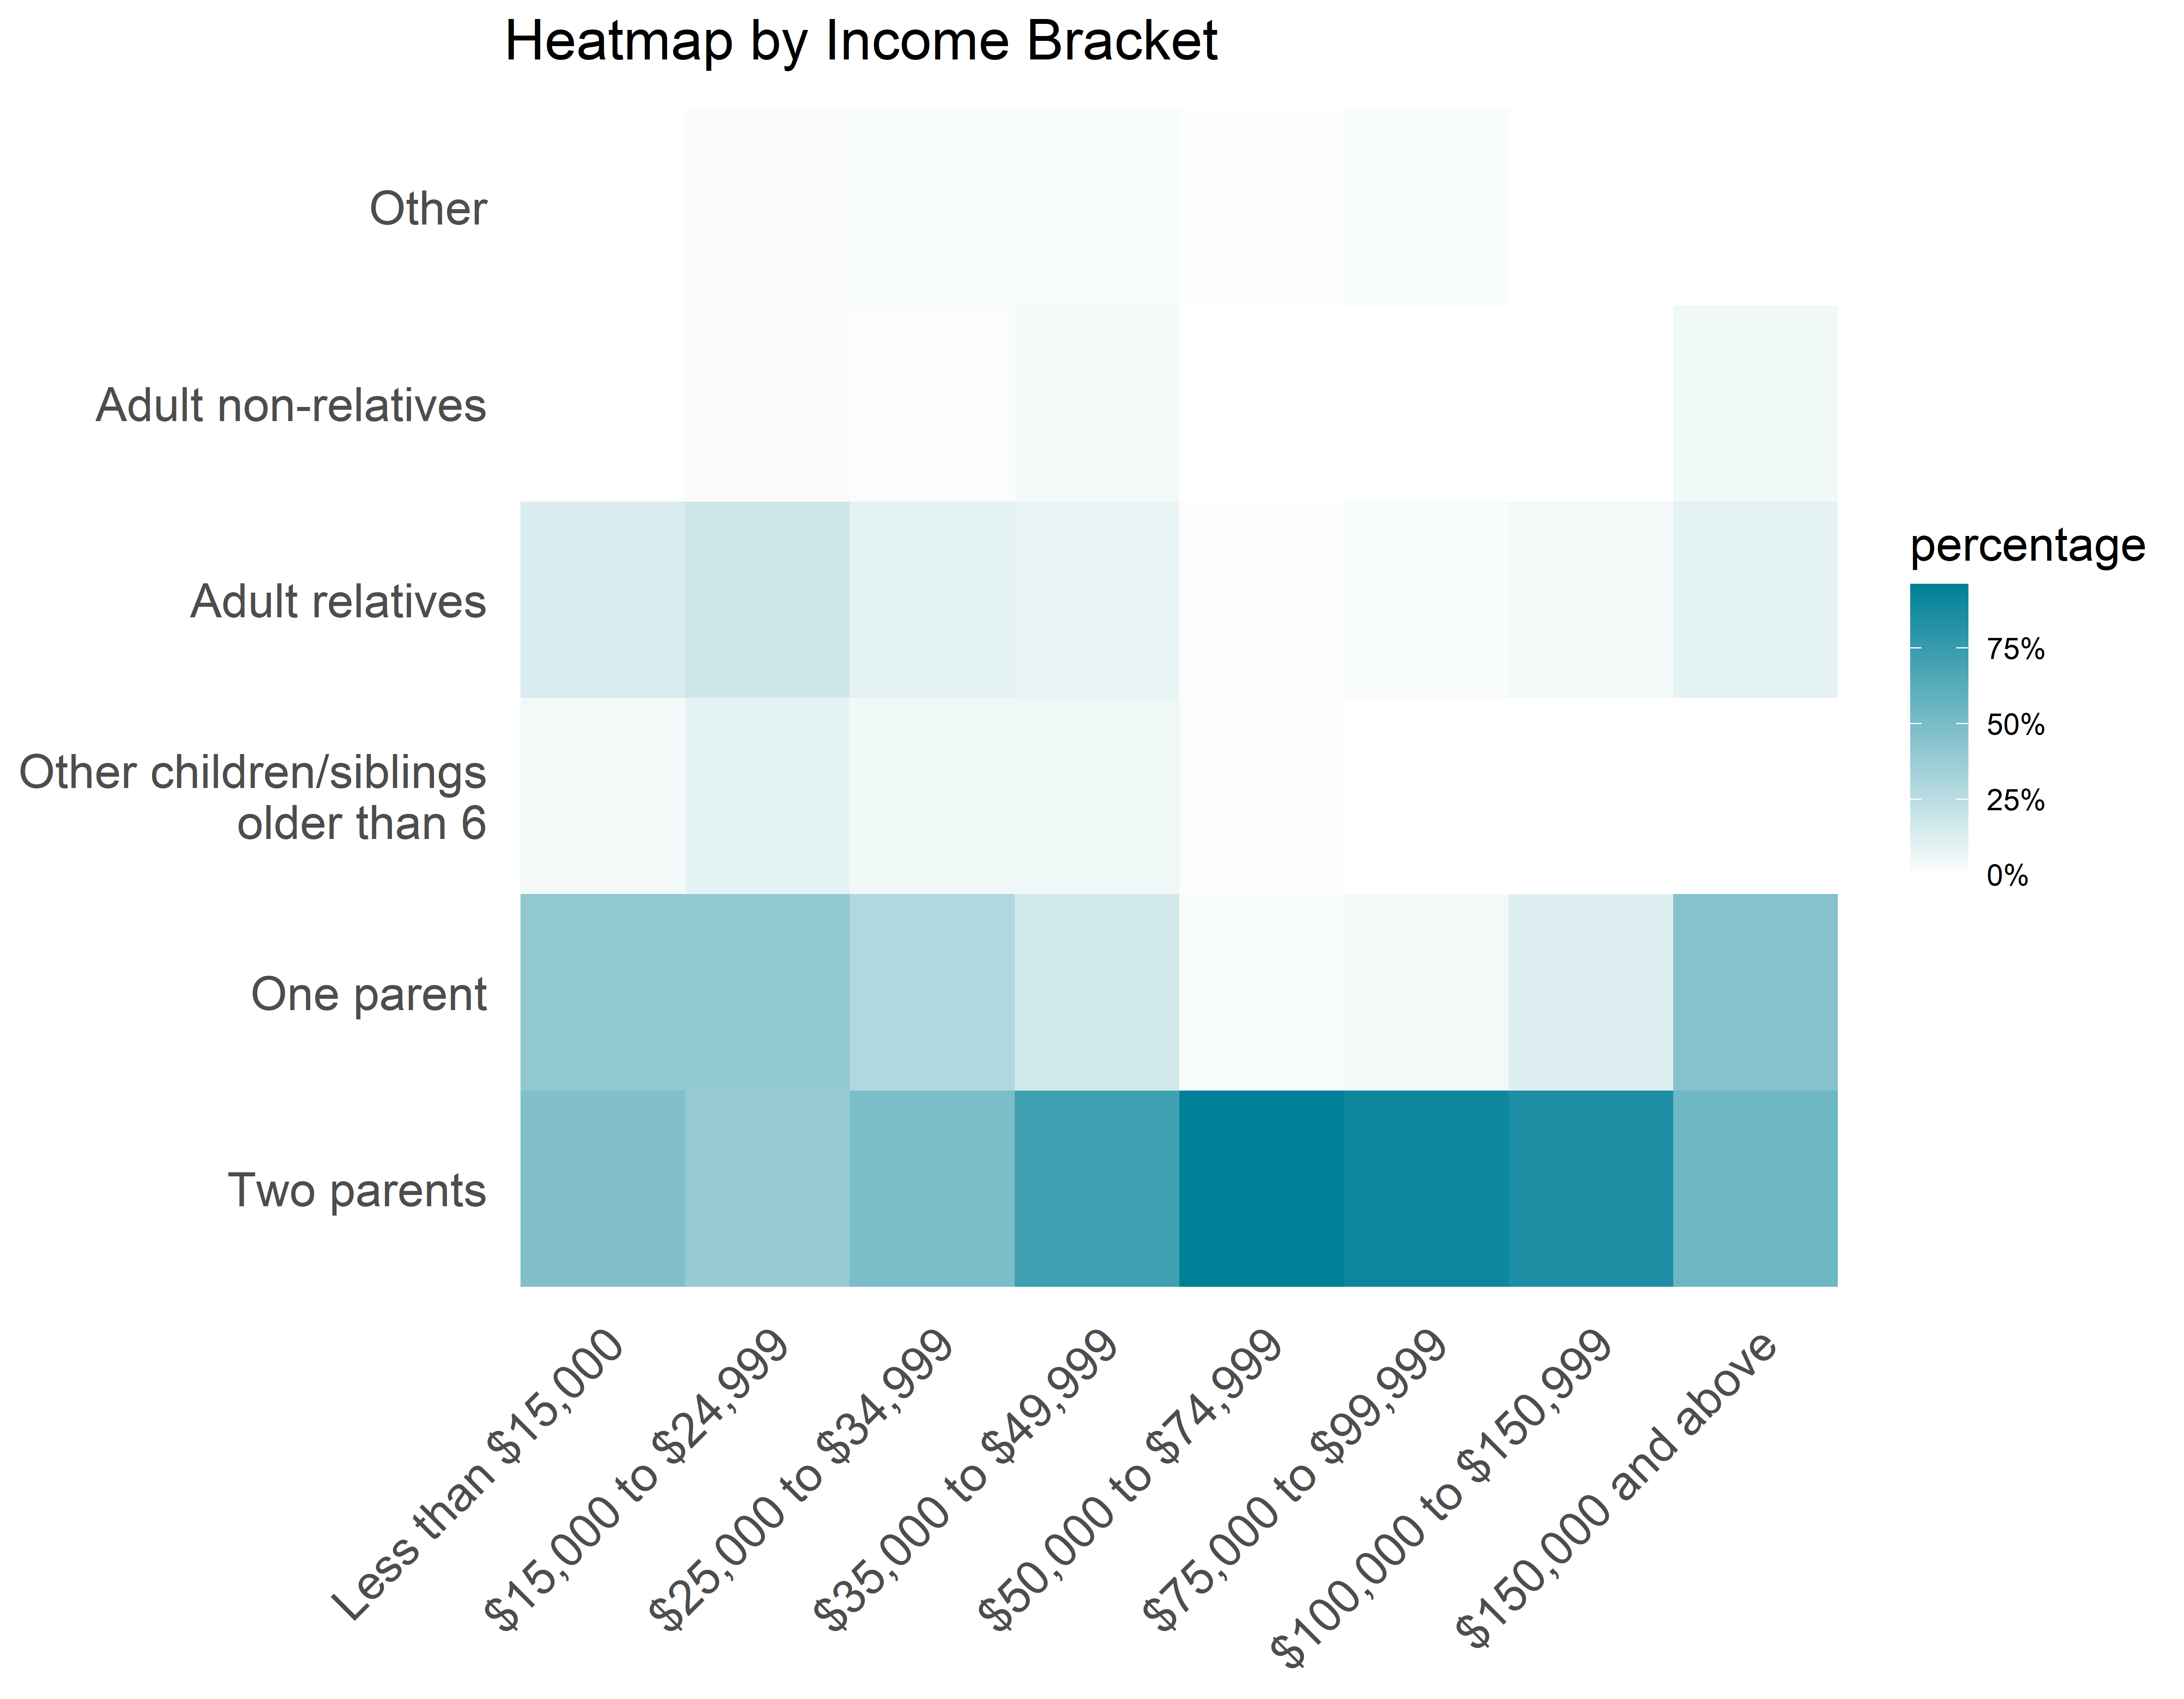
What are the living arrangements for children in your household under the age of 6 years?
Rate of response: 100.0%
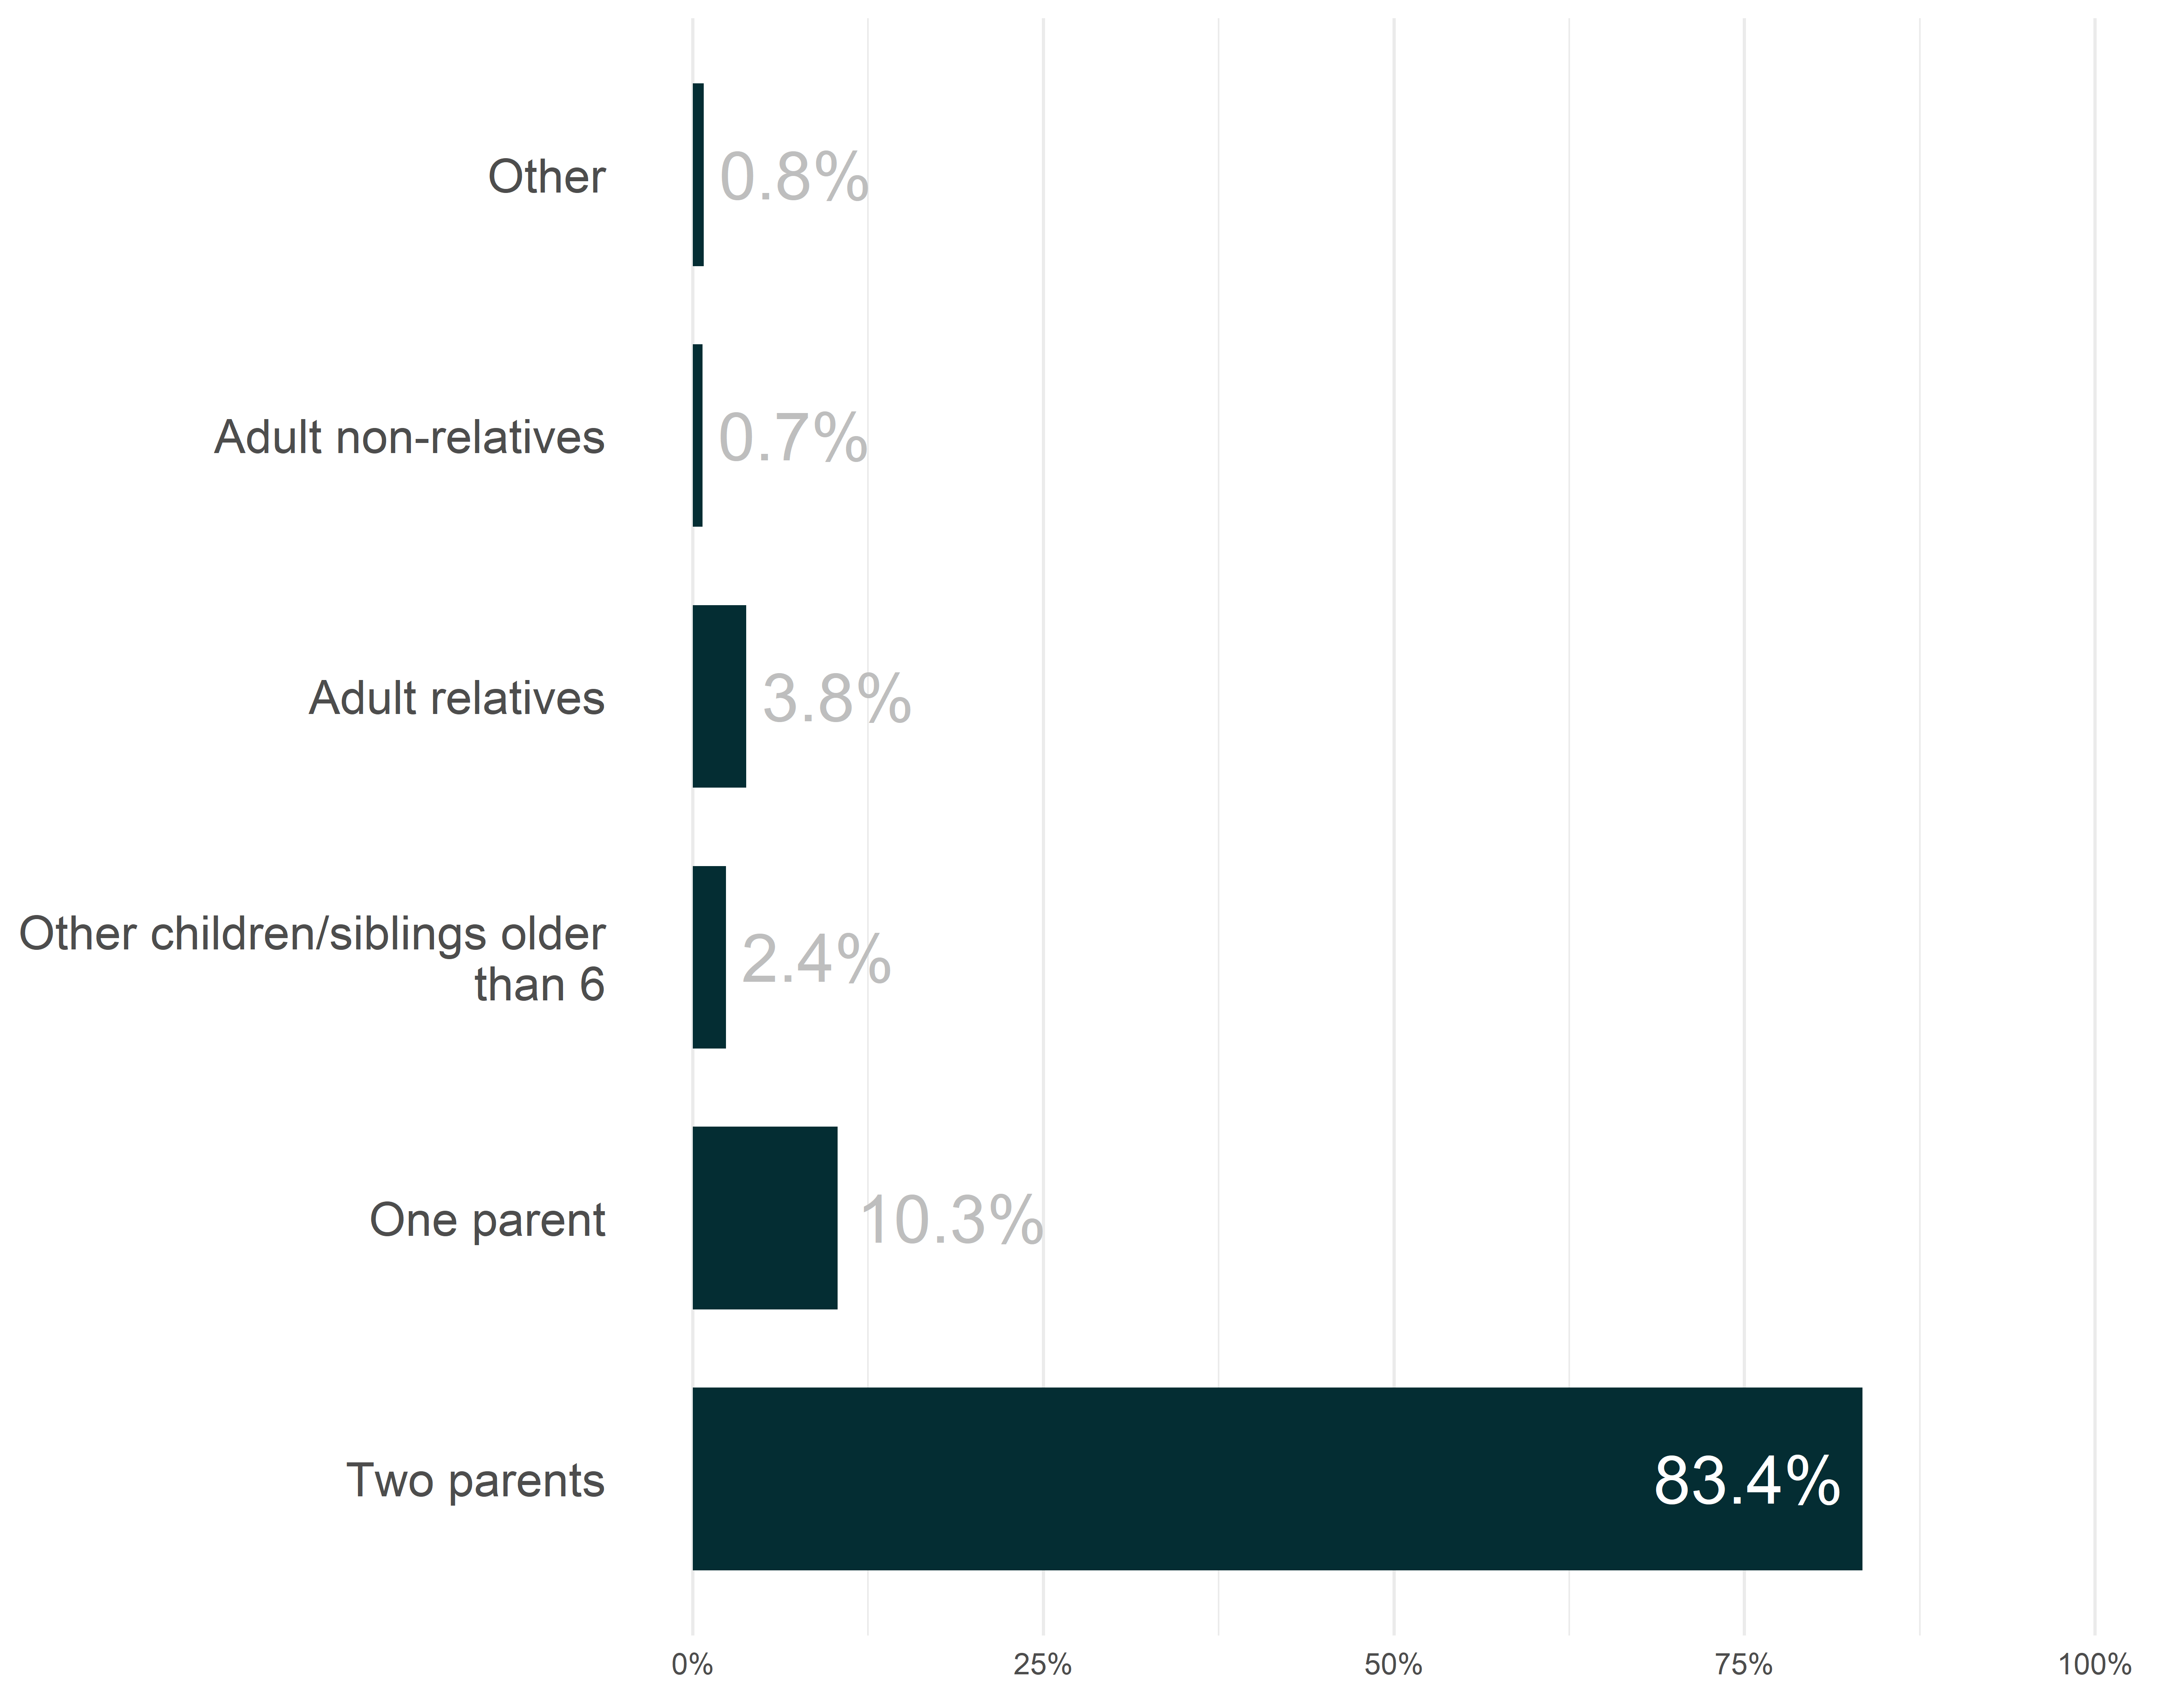
94.4% of respondents with income above $50,000 report a two-parent living arrangement, compared to only 57.4% of respondents with an income below $50,000.
CPAL.INTERNET.001
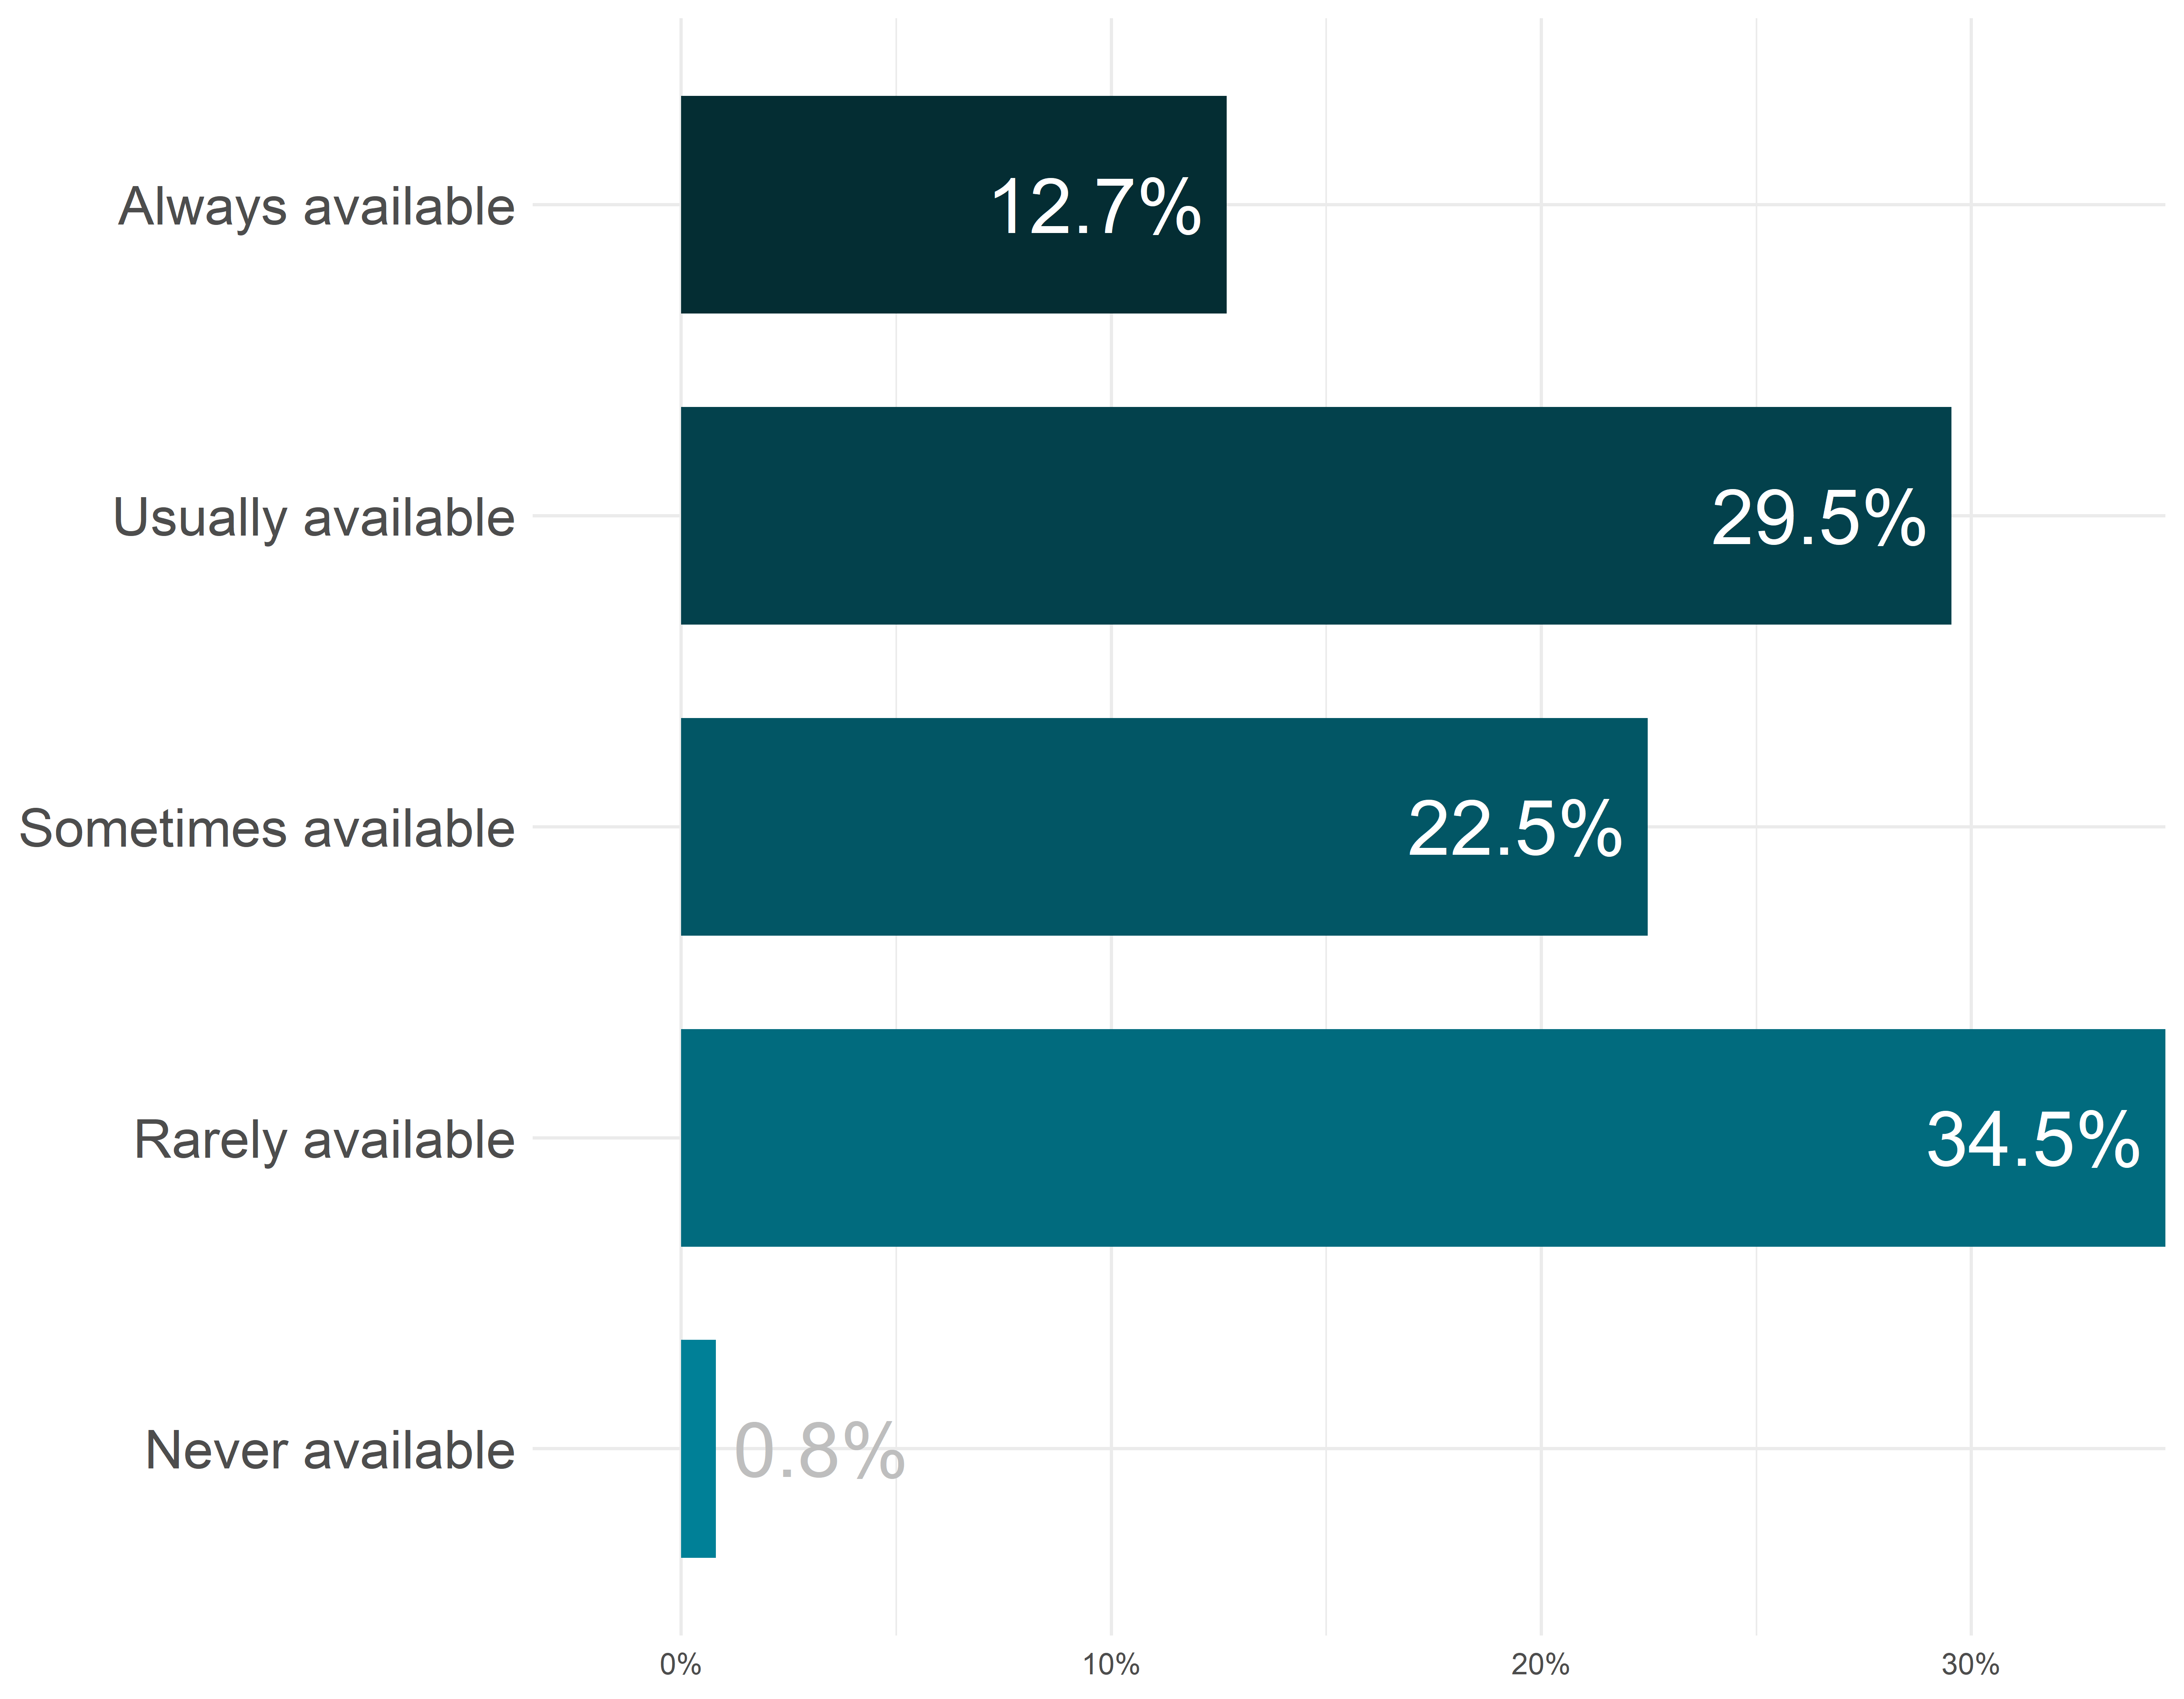
How often is the internet available to people in your household?
Rate of response: 99.0%
CPAL.HOME.005
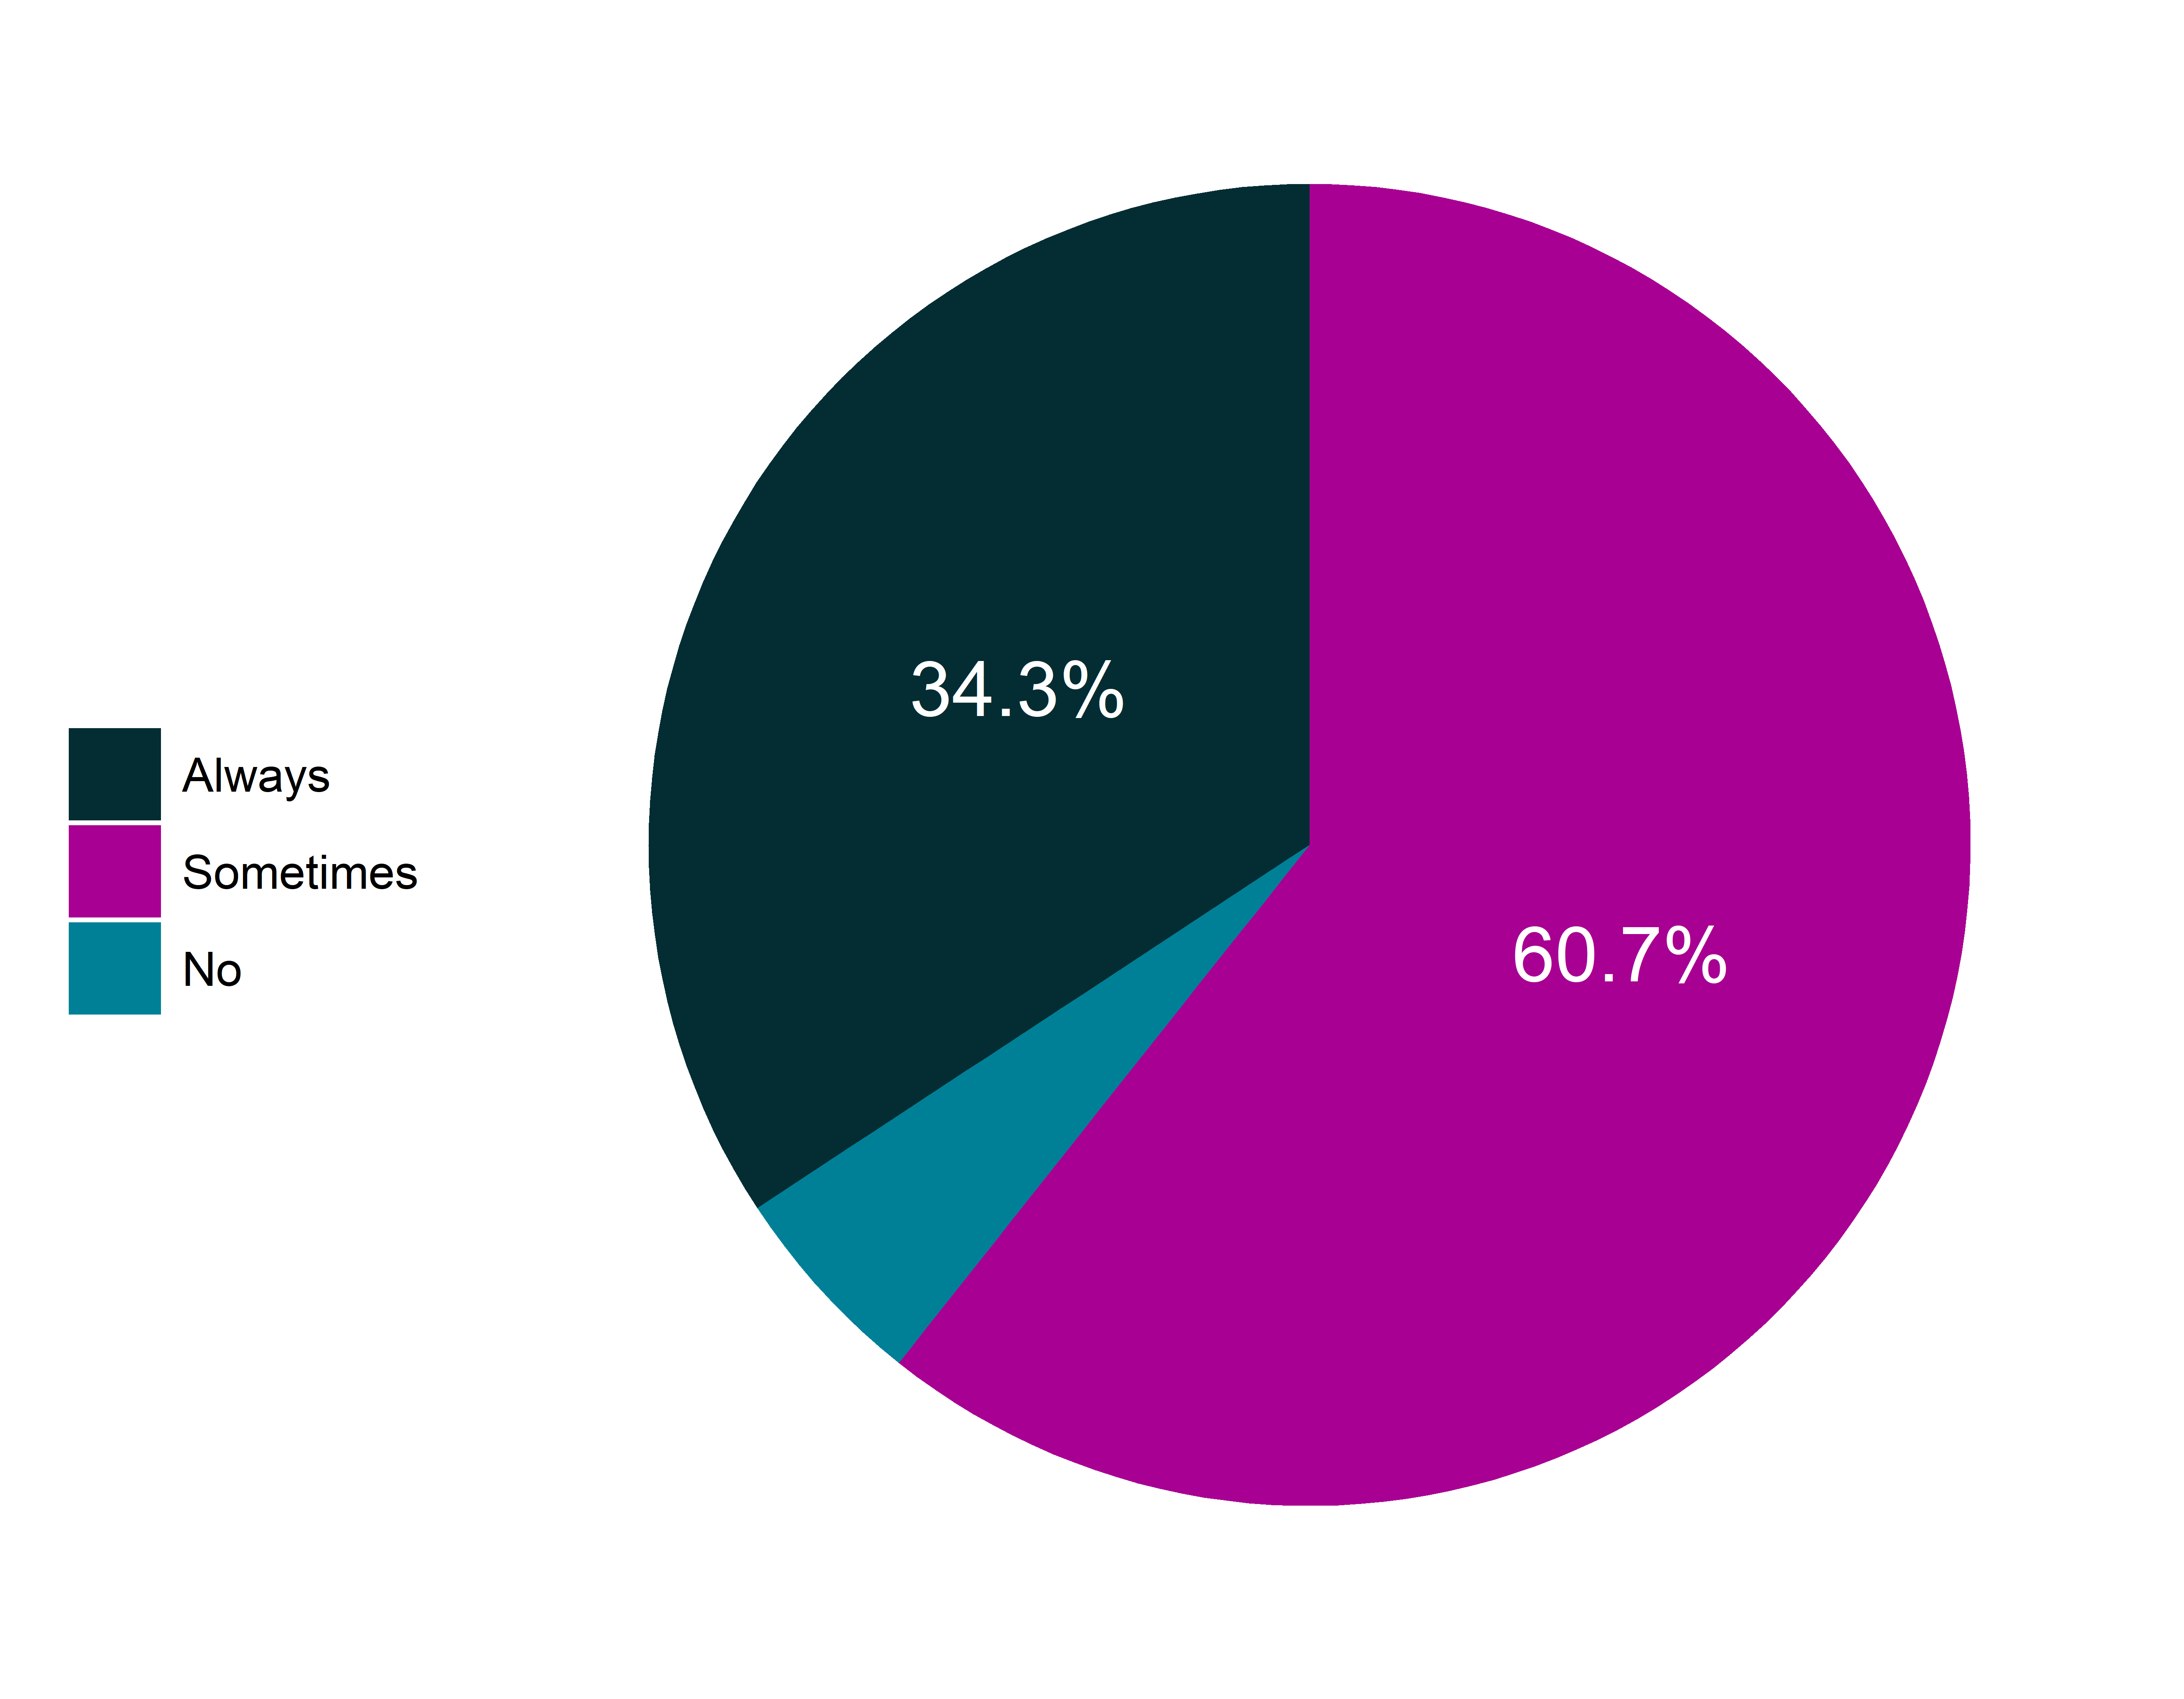
Is your home’s heating equipment able to keep you warm in the winter?
Rate of response: 83.0%
CPAL.HOME.006
Is your home’s cooling equipment (air conditioning, fans, etc.) able to keep you cool in the summer?
Rate of response: 82.9%
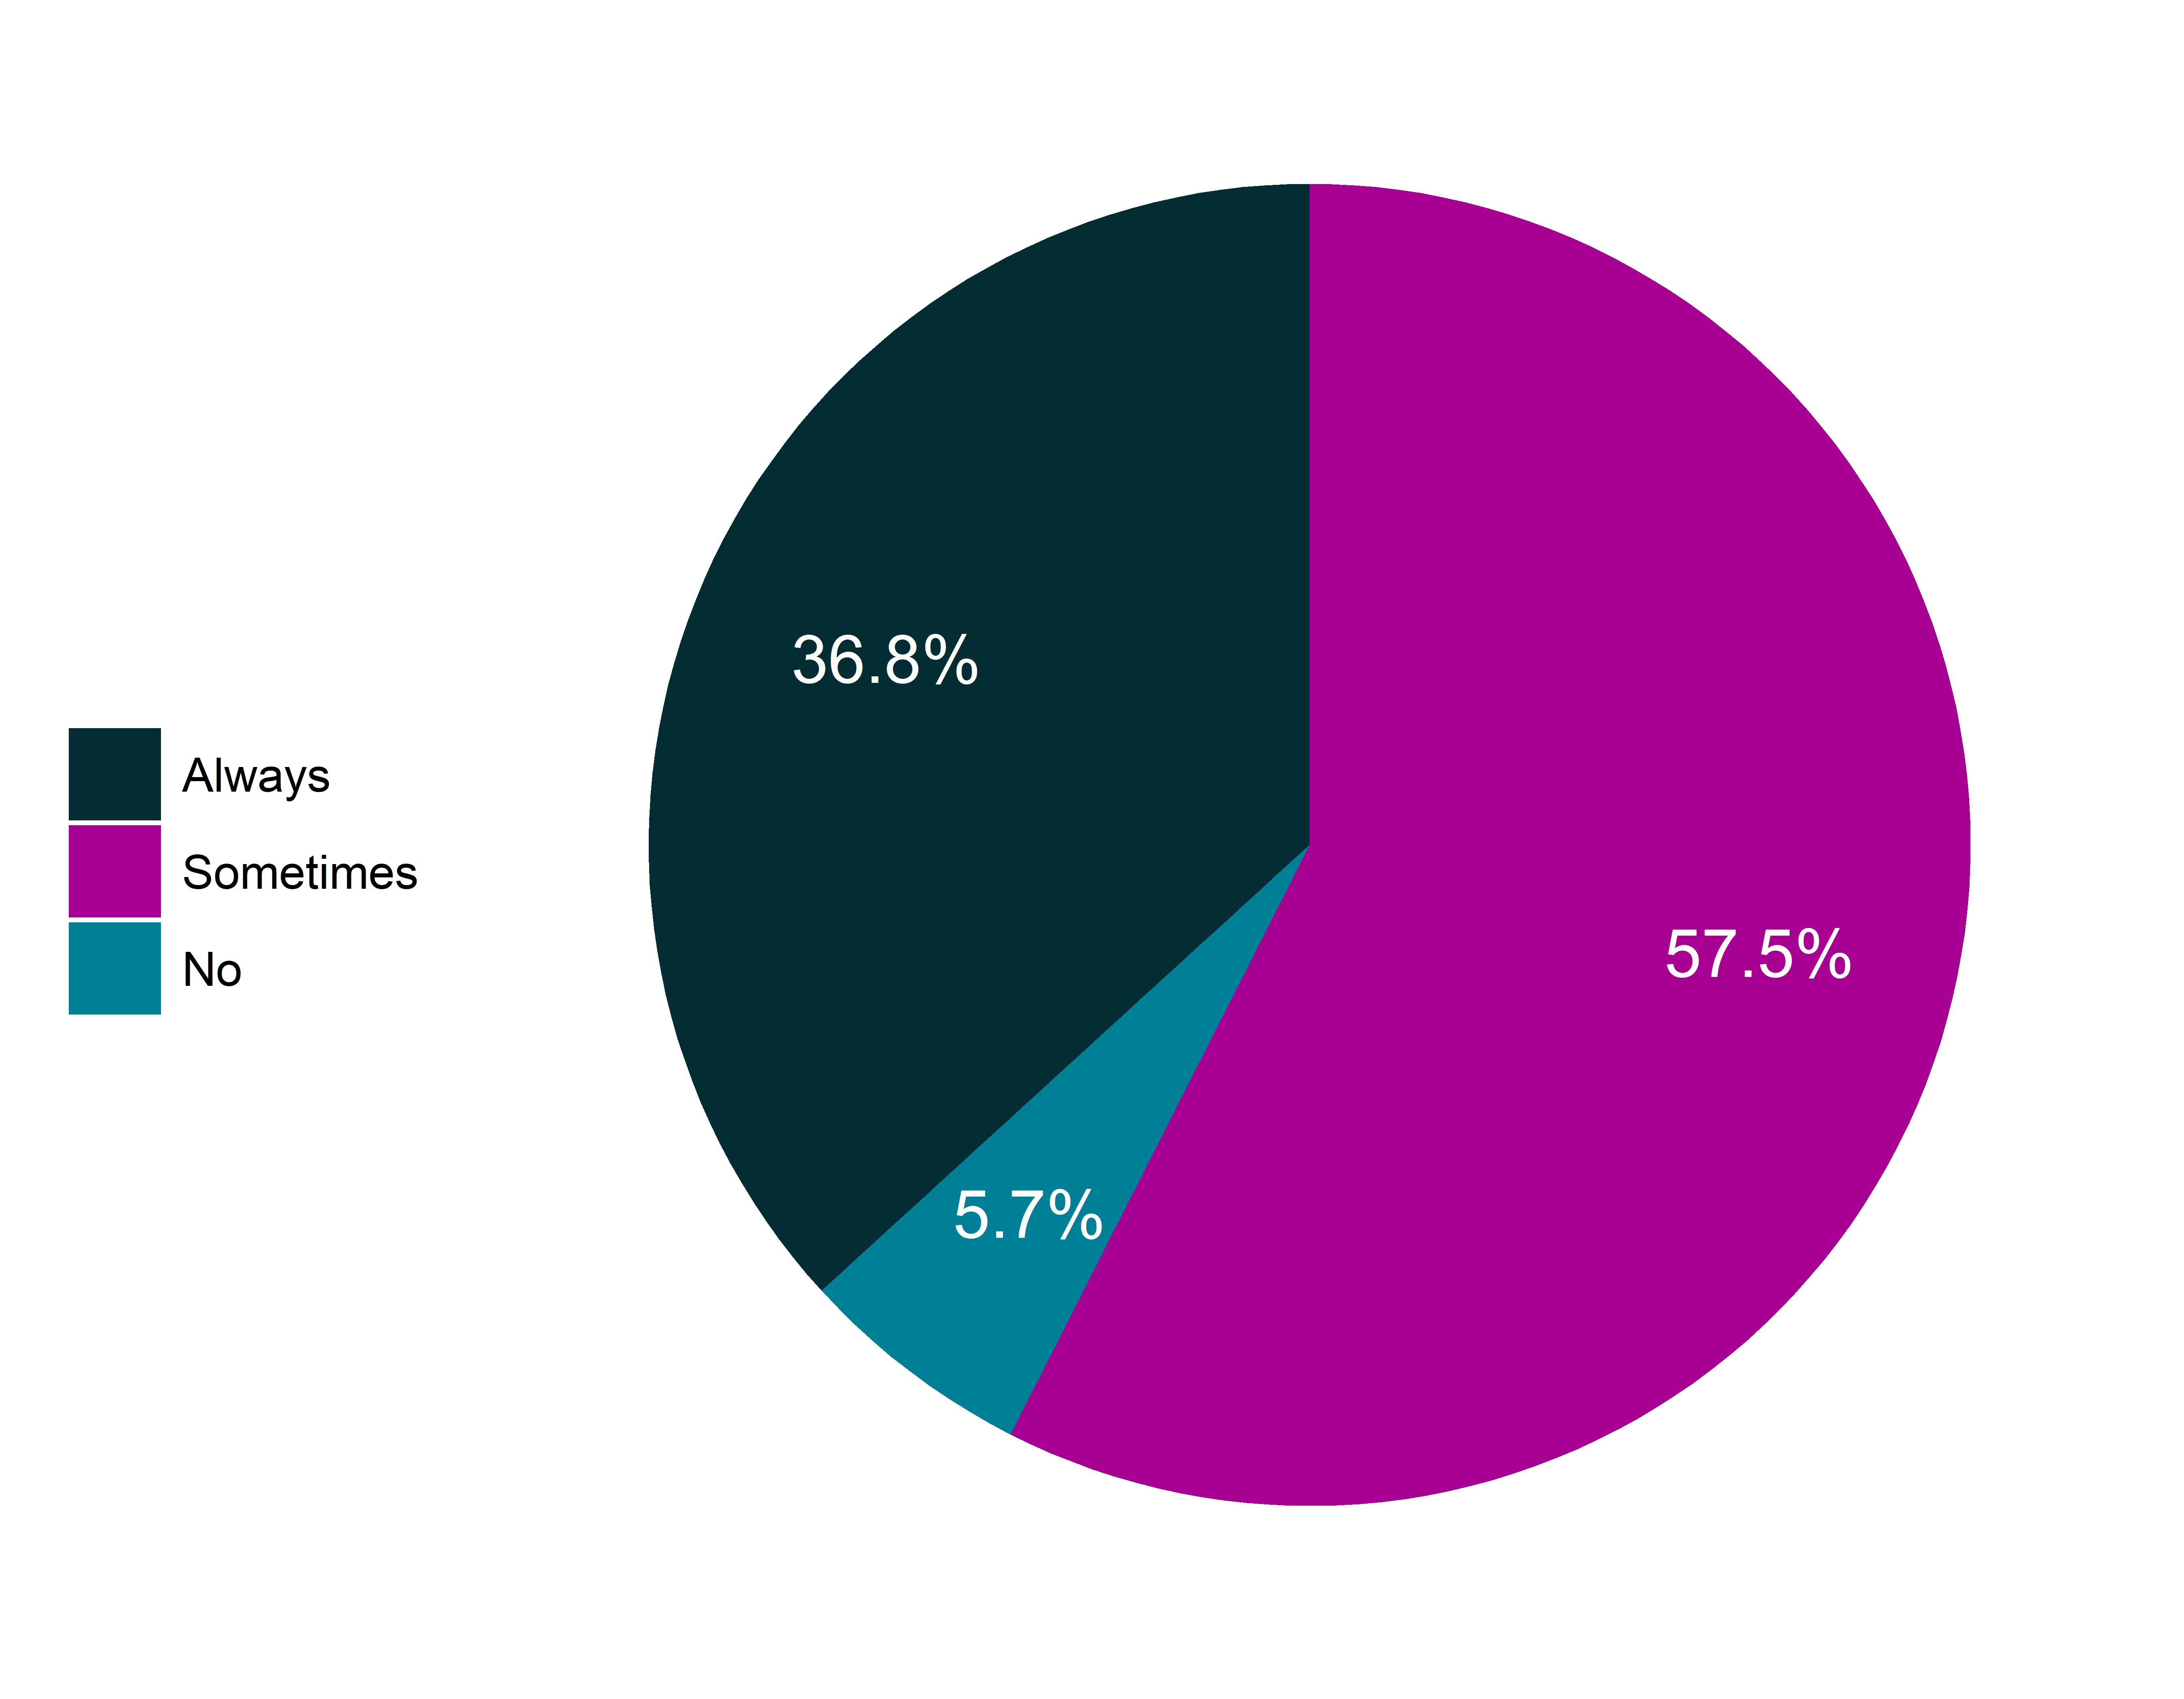
In total, only 17.3% of respondents say that both their heating and cooling always work at home.
CPAL.MH.009
In the last 30 days, were you evicted from the place you rented?
Rate of response (renters): 95.7%
Rate of response (total): 70.8%
5.2% of renters report being evicted in the past 30 days.
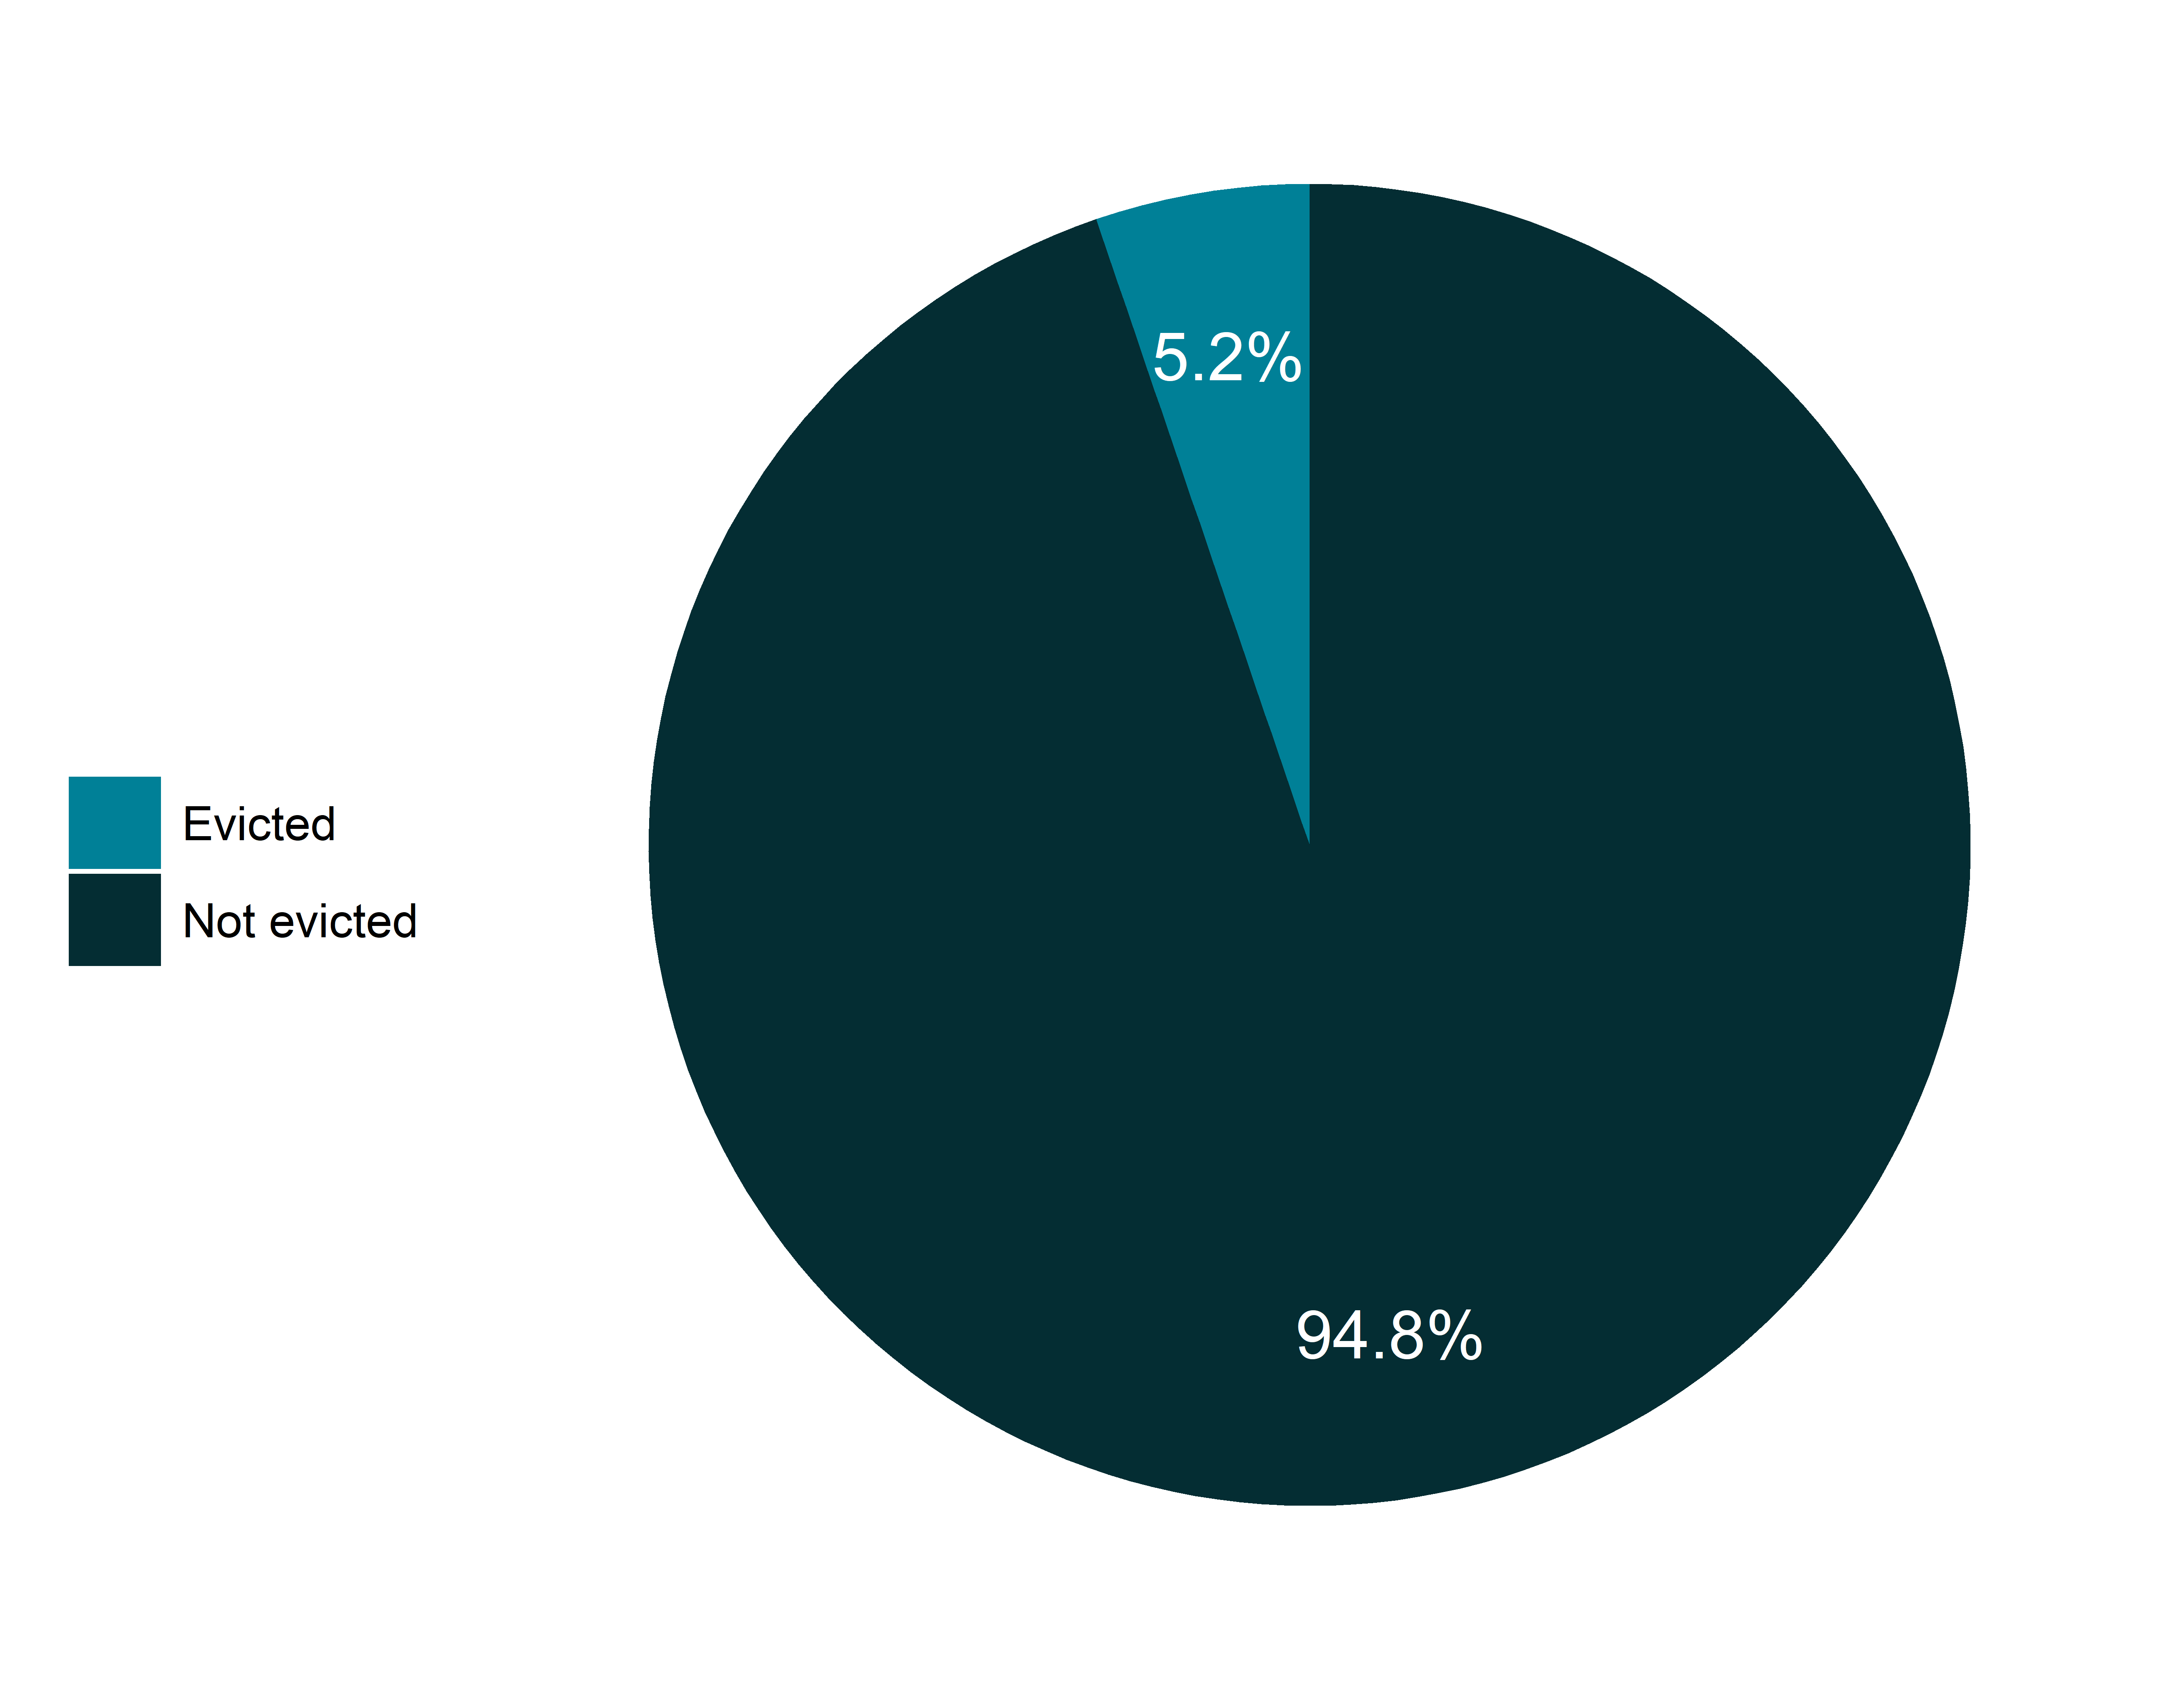
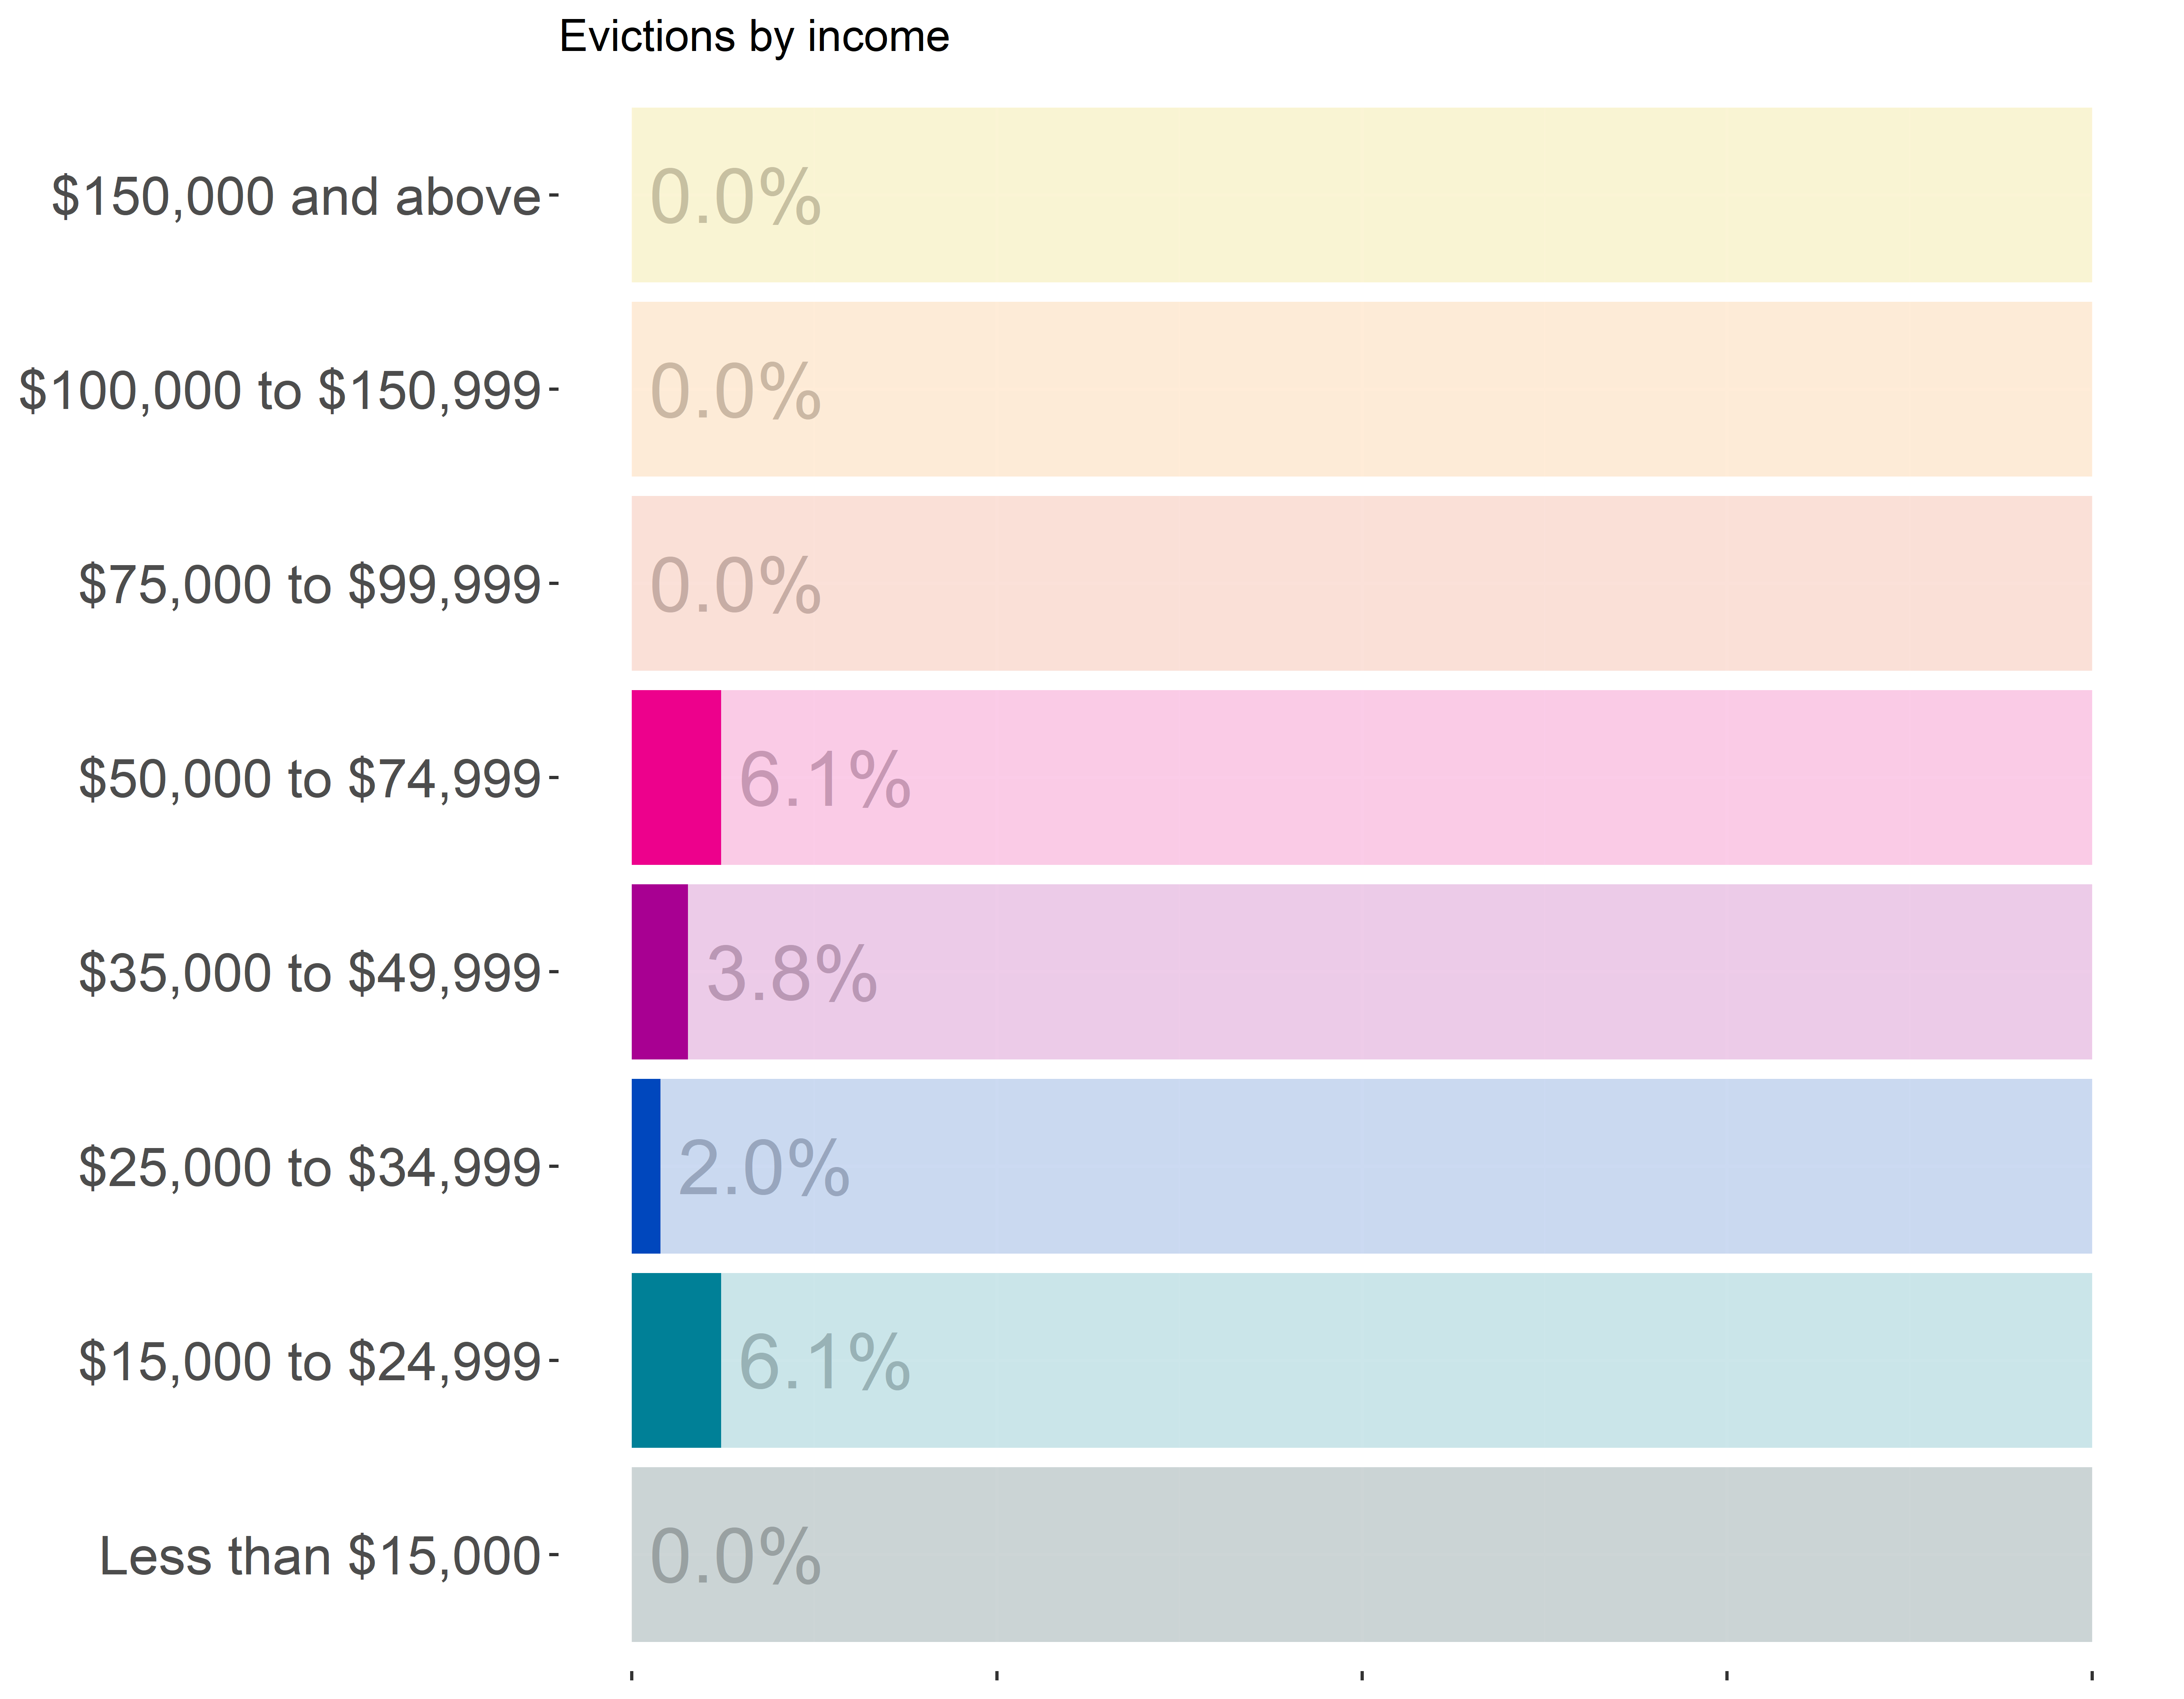
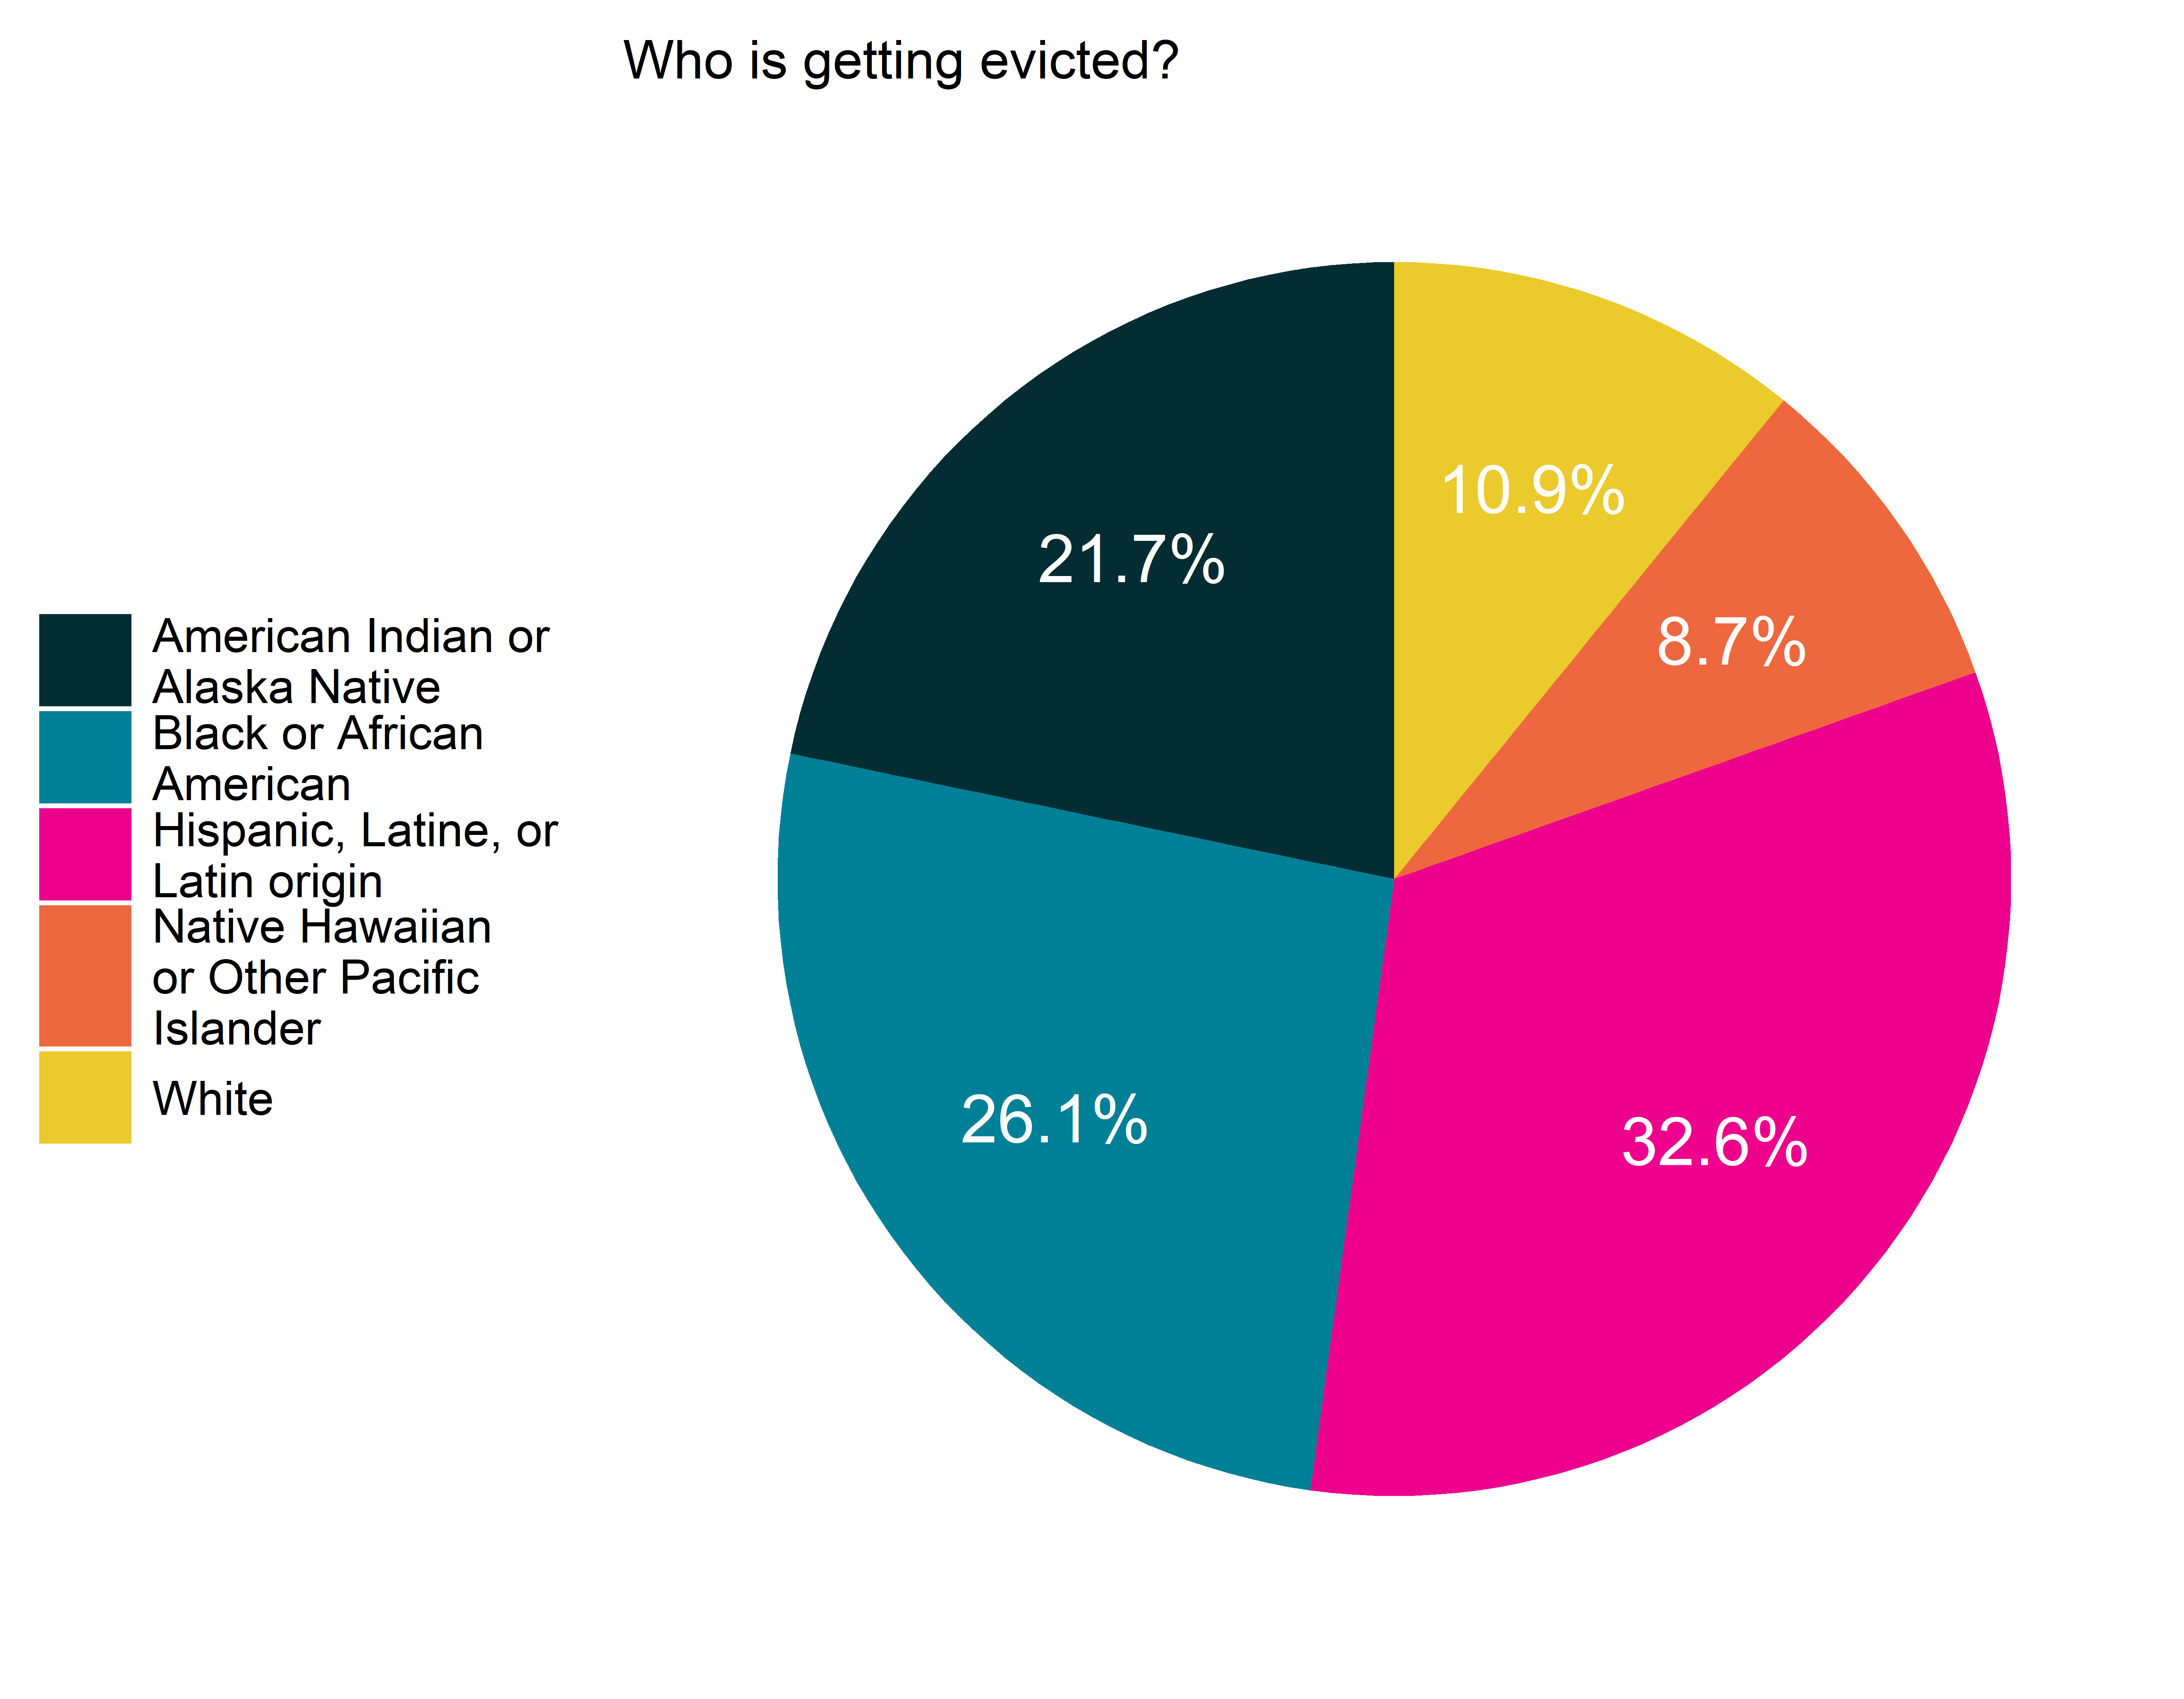
Note: evictions \(n=46\).
CPAL.MH.010
In the last 30 days, was your mortgage foreclosed on?
Rate of response (homeowners): 96.7%
Rate of response (total): 21.0%
9.5% of homeowners report being foreclosed on in the past 30 days.
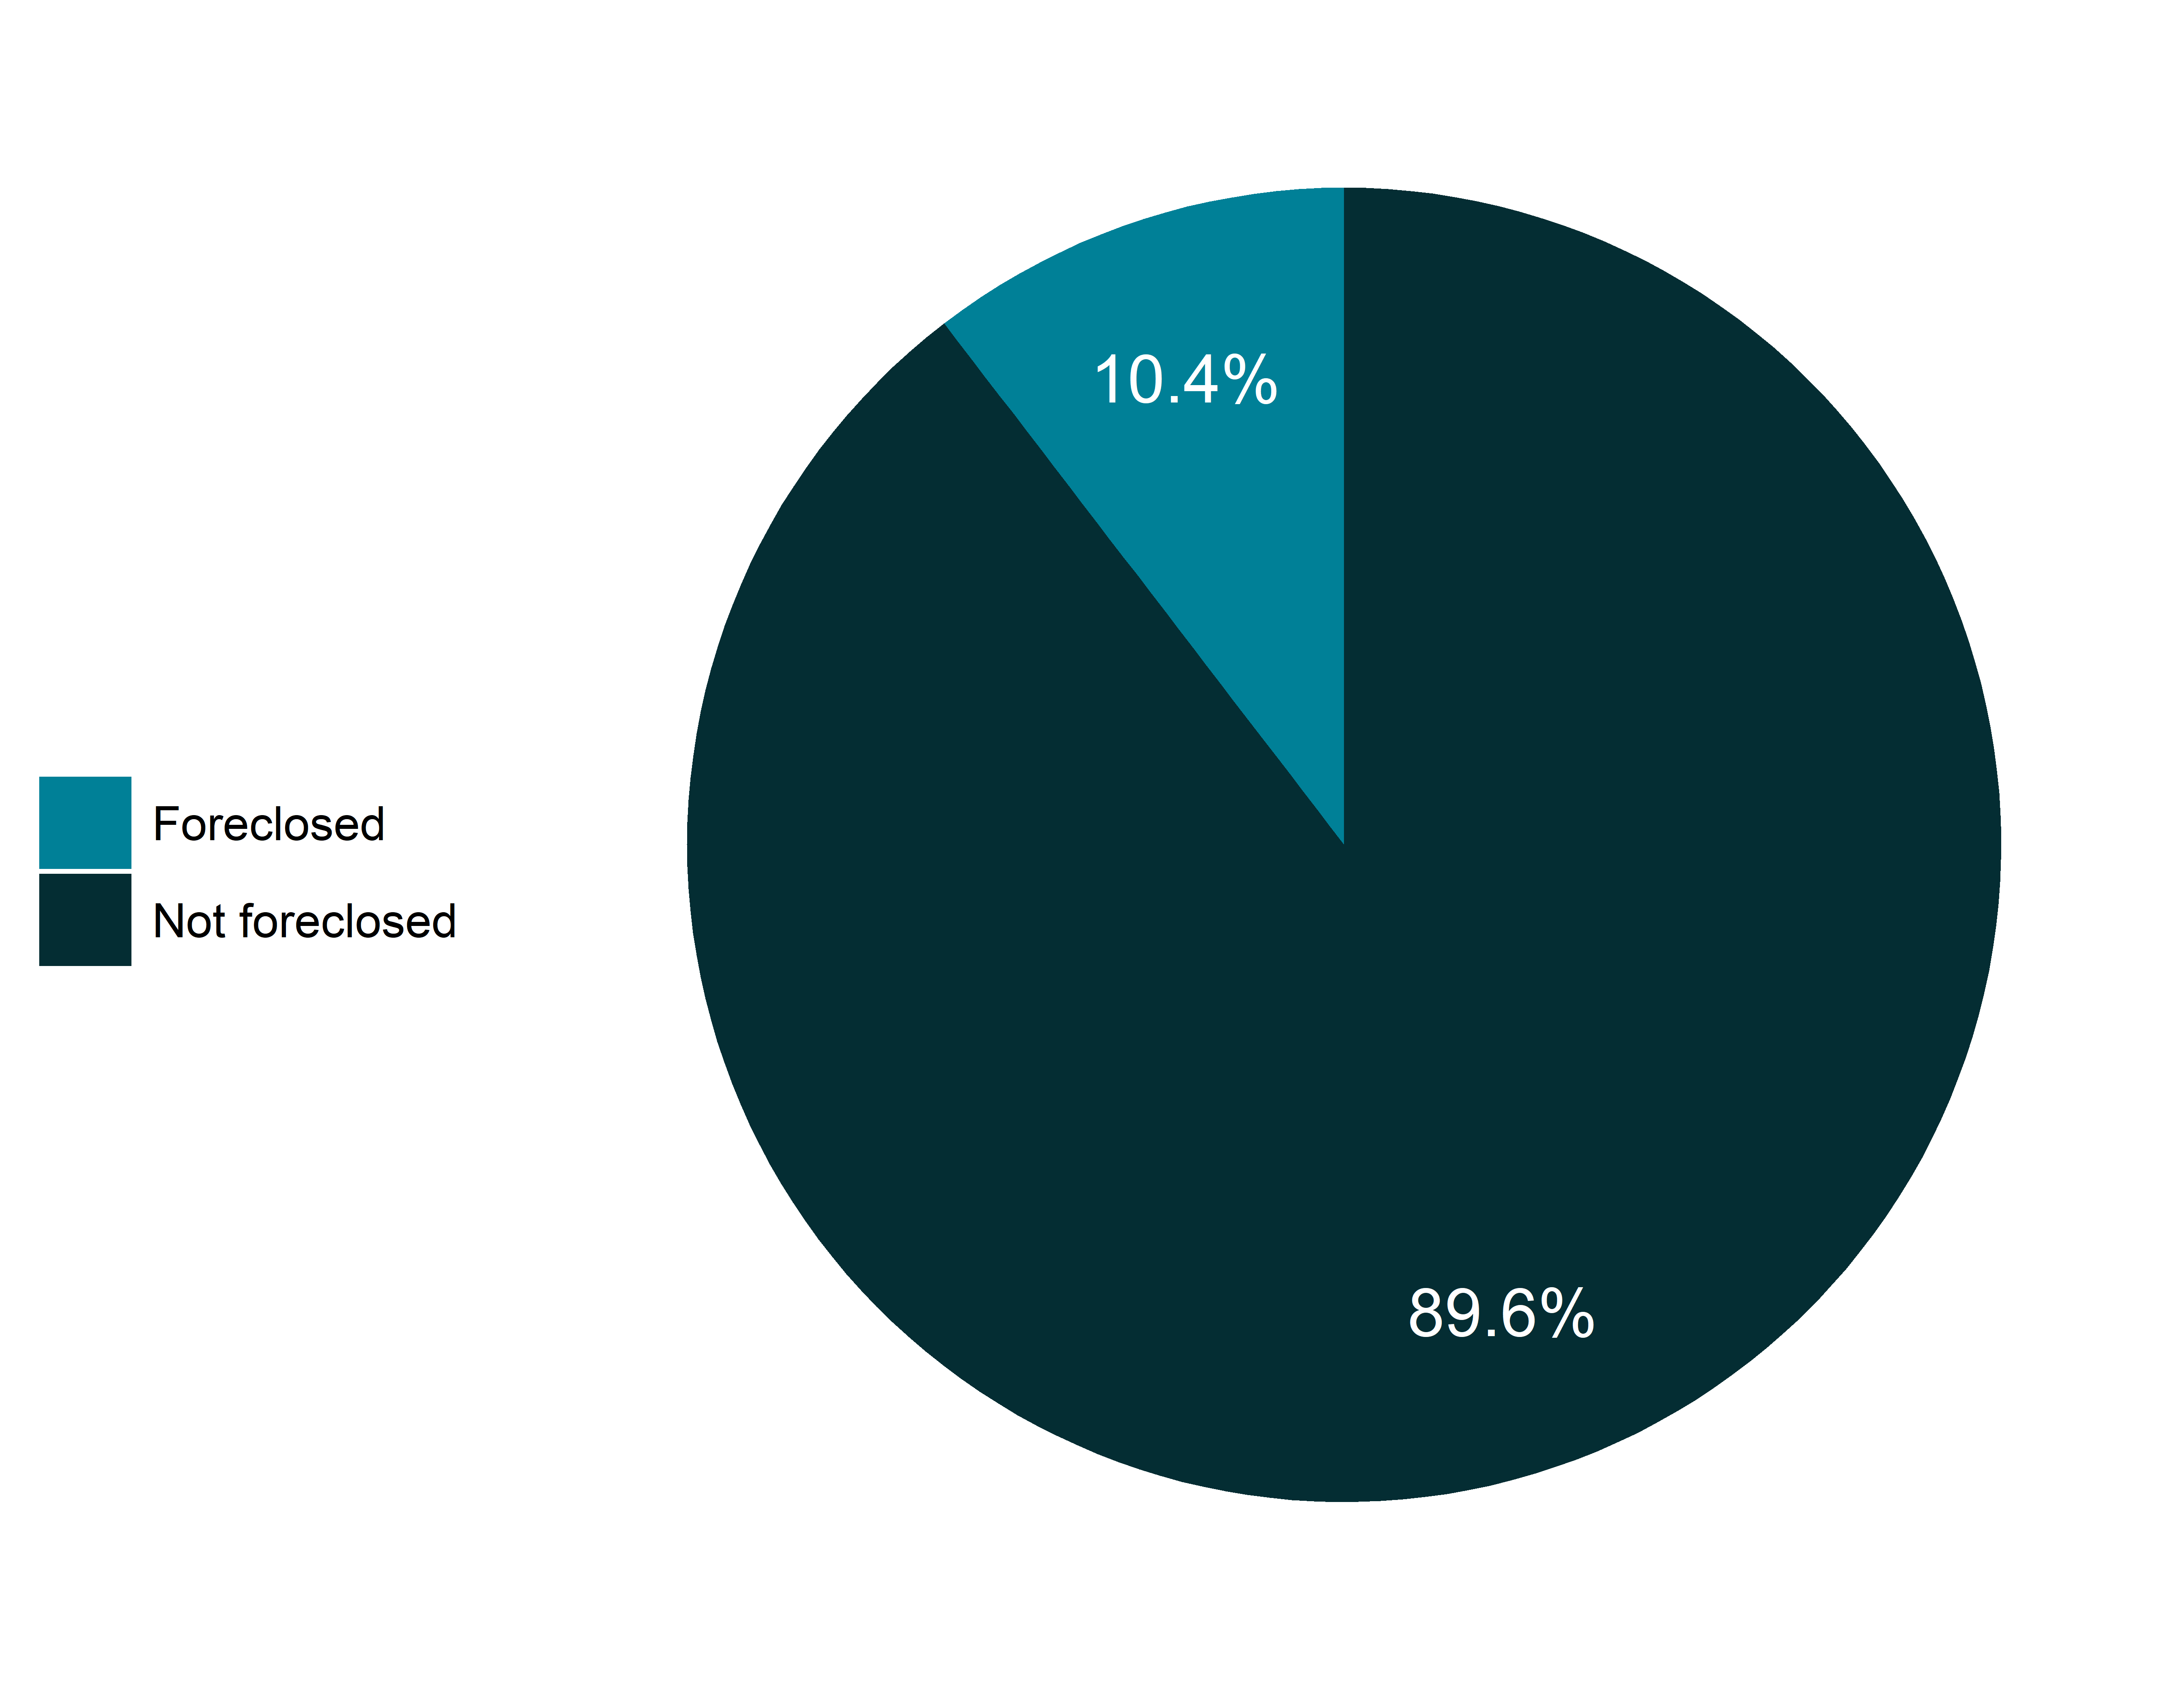
Most homeowners make less than $100,000, as do all who were foreclosed on.
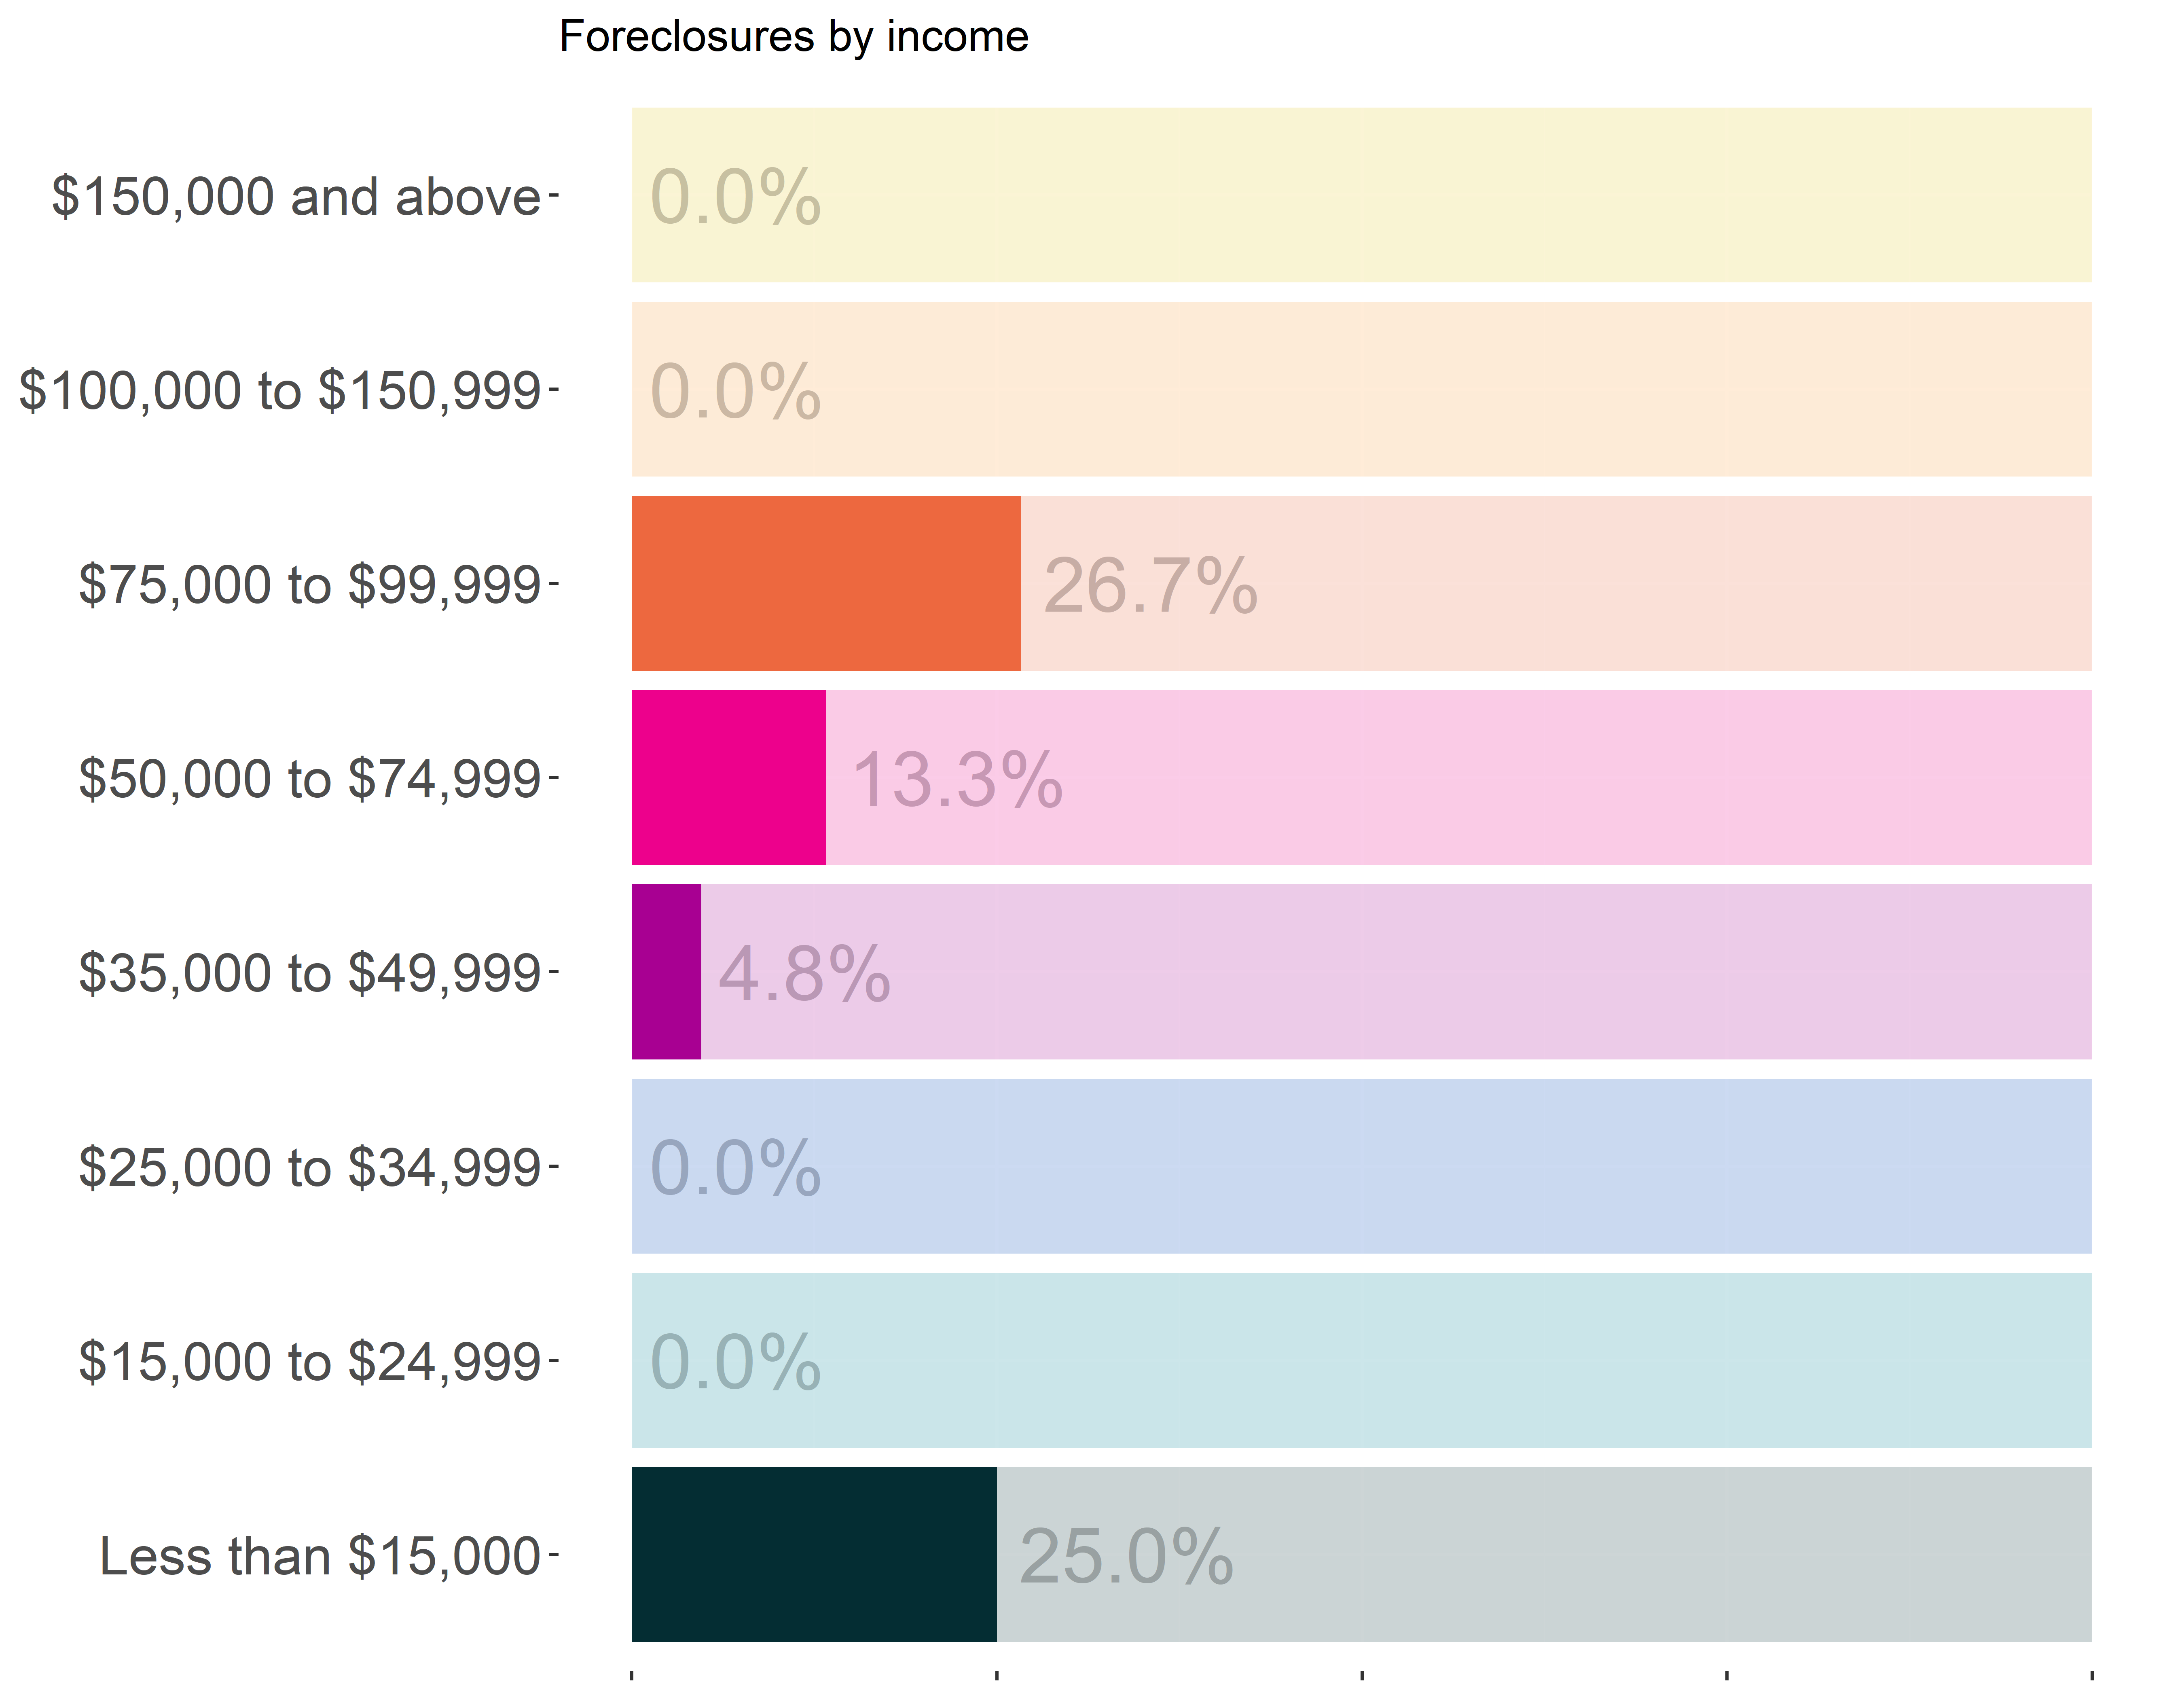
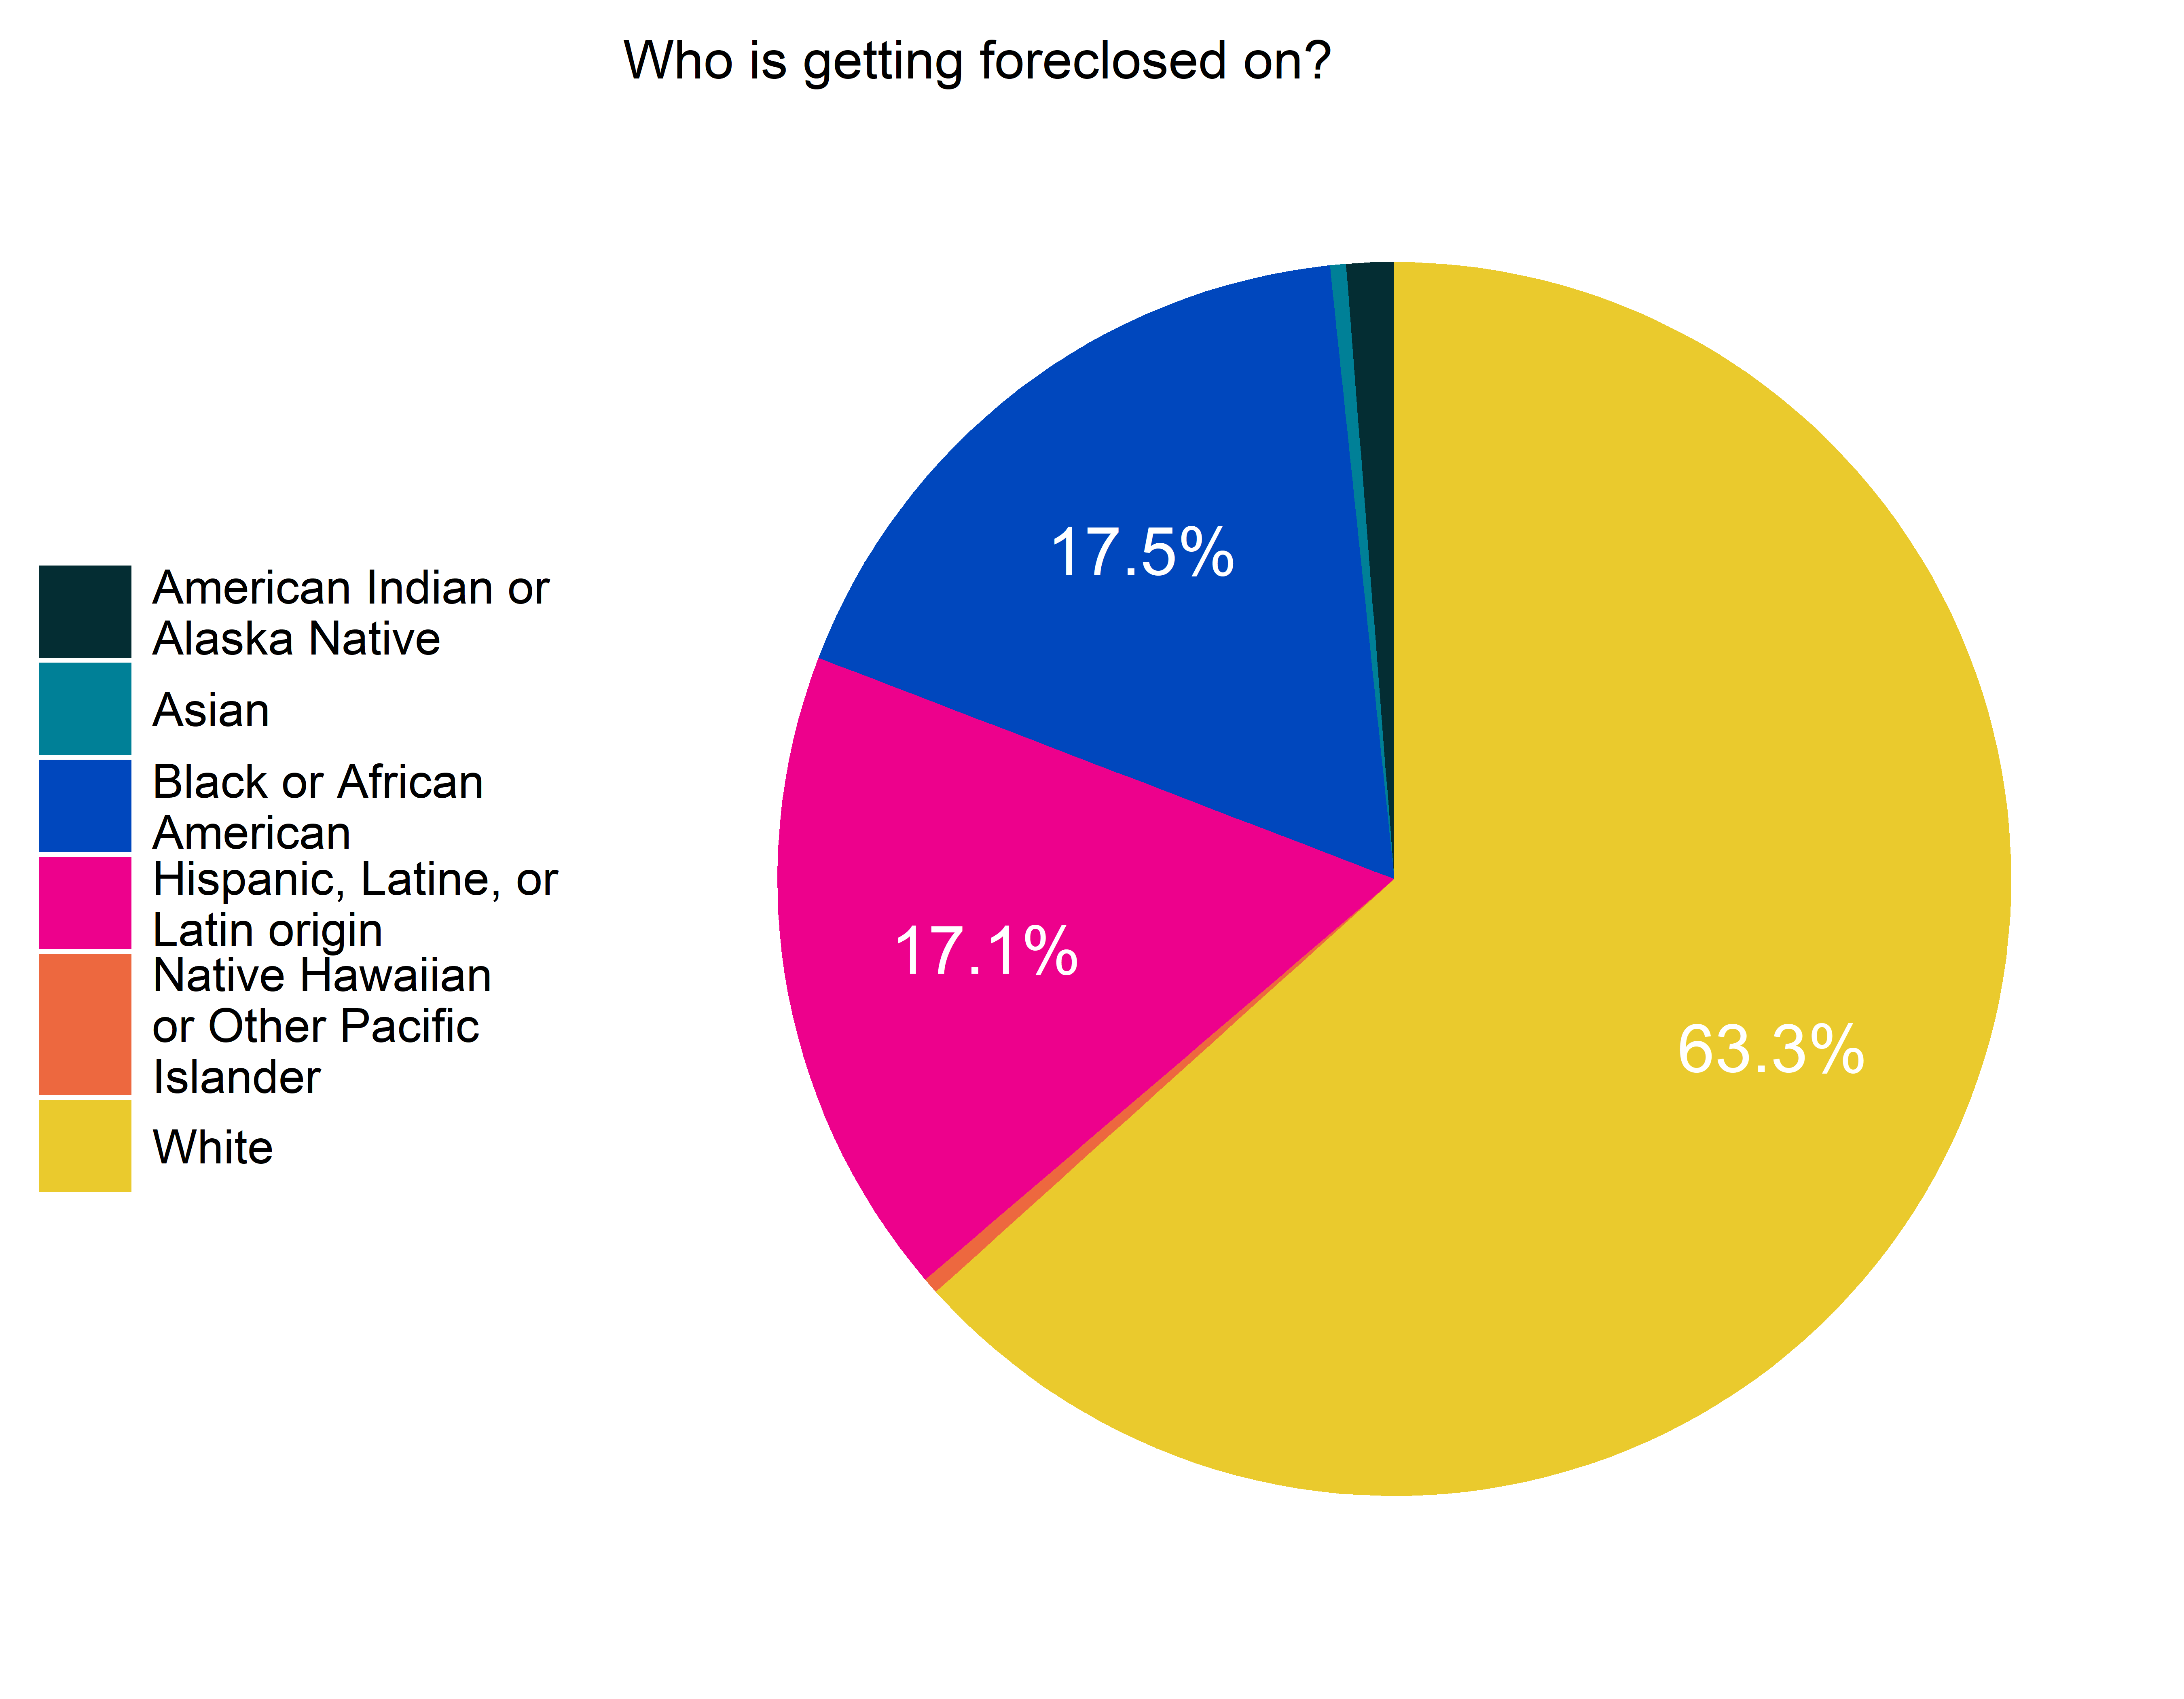
Note: foreclosures \(n=25\).
The selection of homeowners in lower income ranges is likely due to data misentry; we are currently still reviewing these responses.
CPAL.DALLASCORE.003
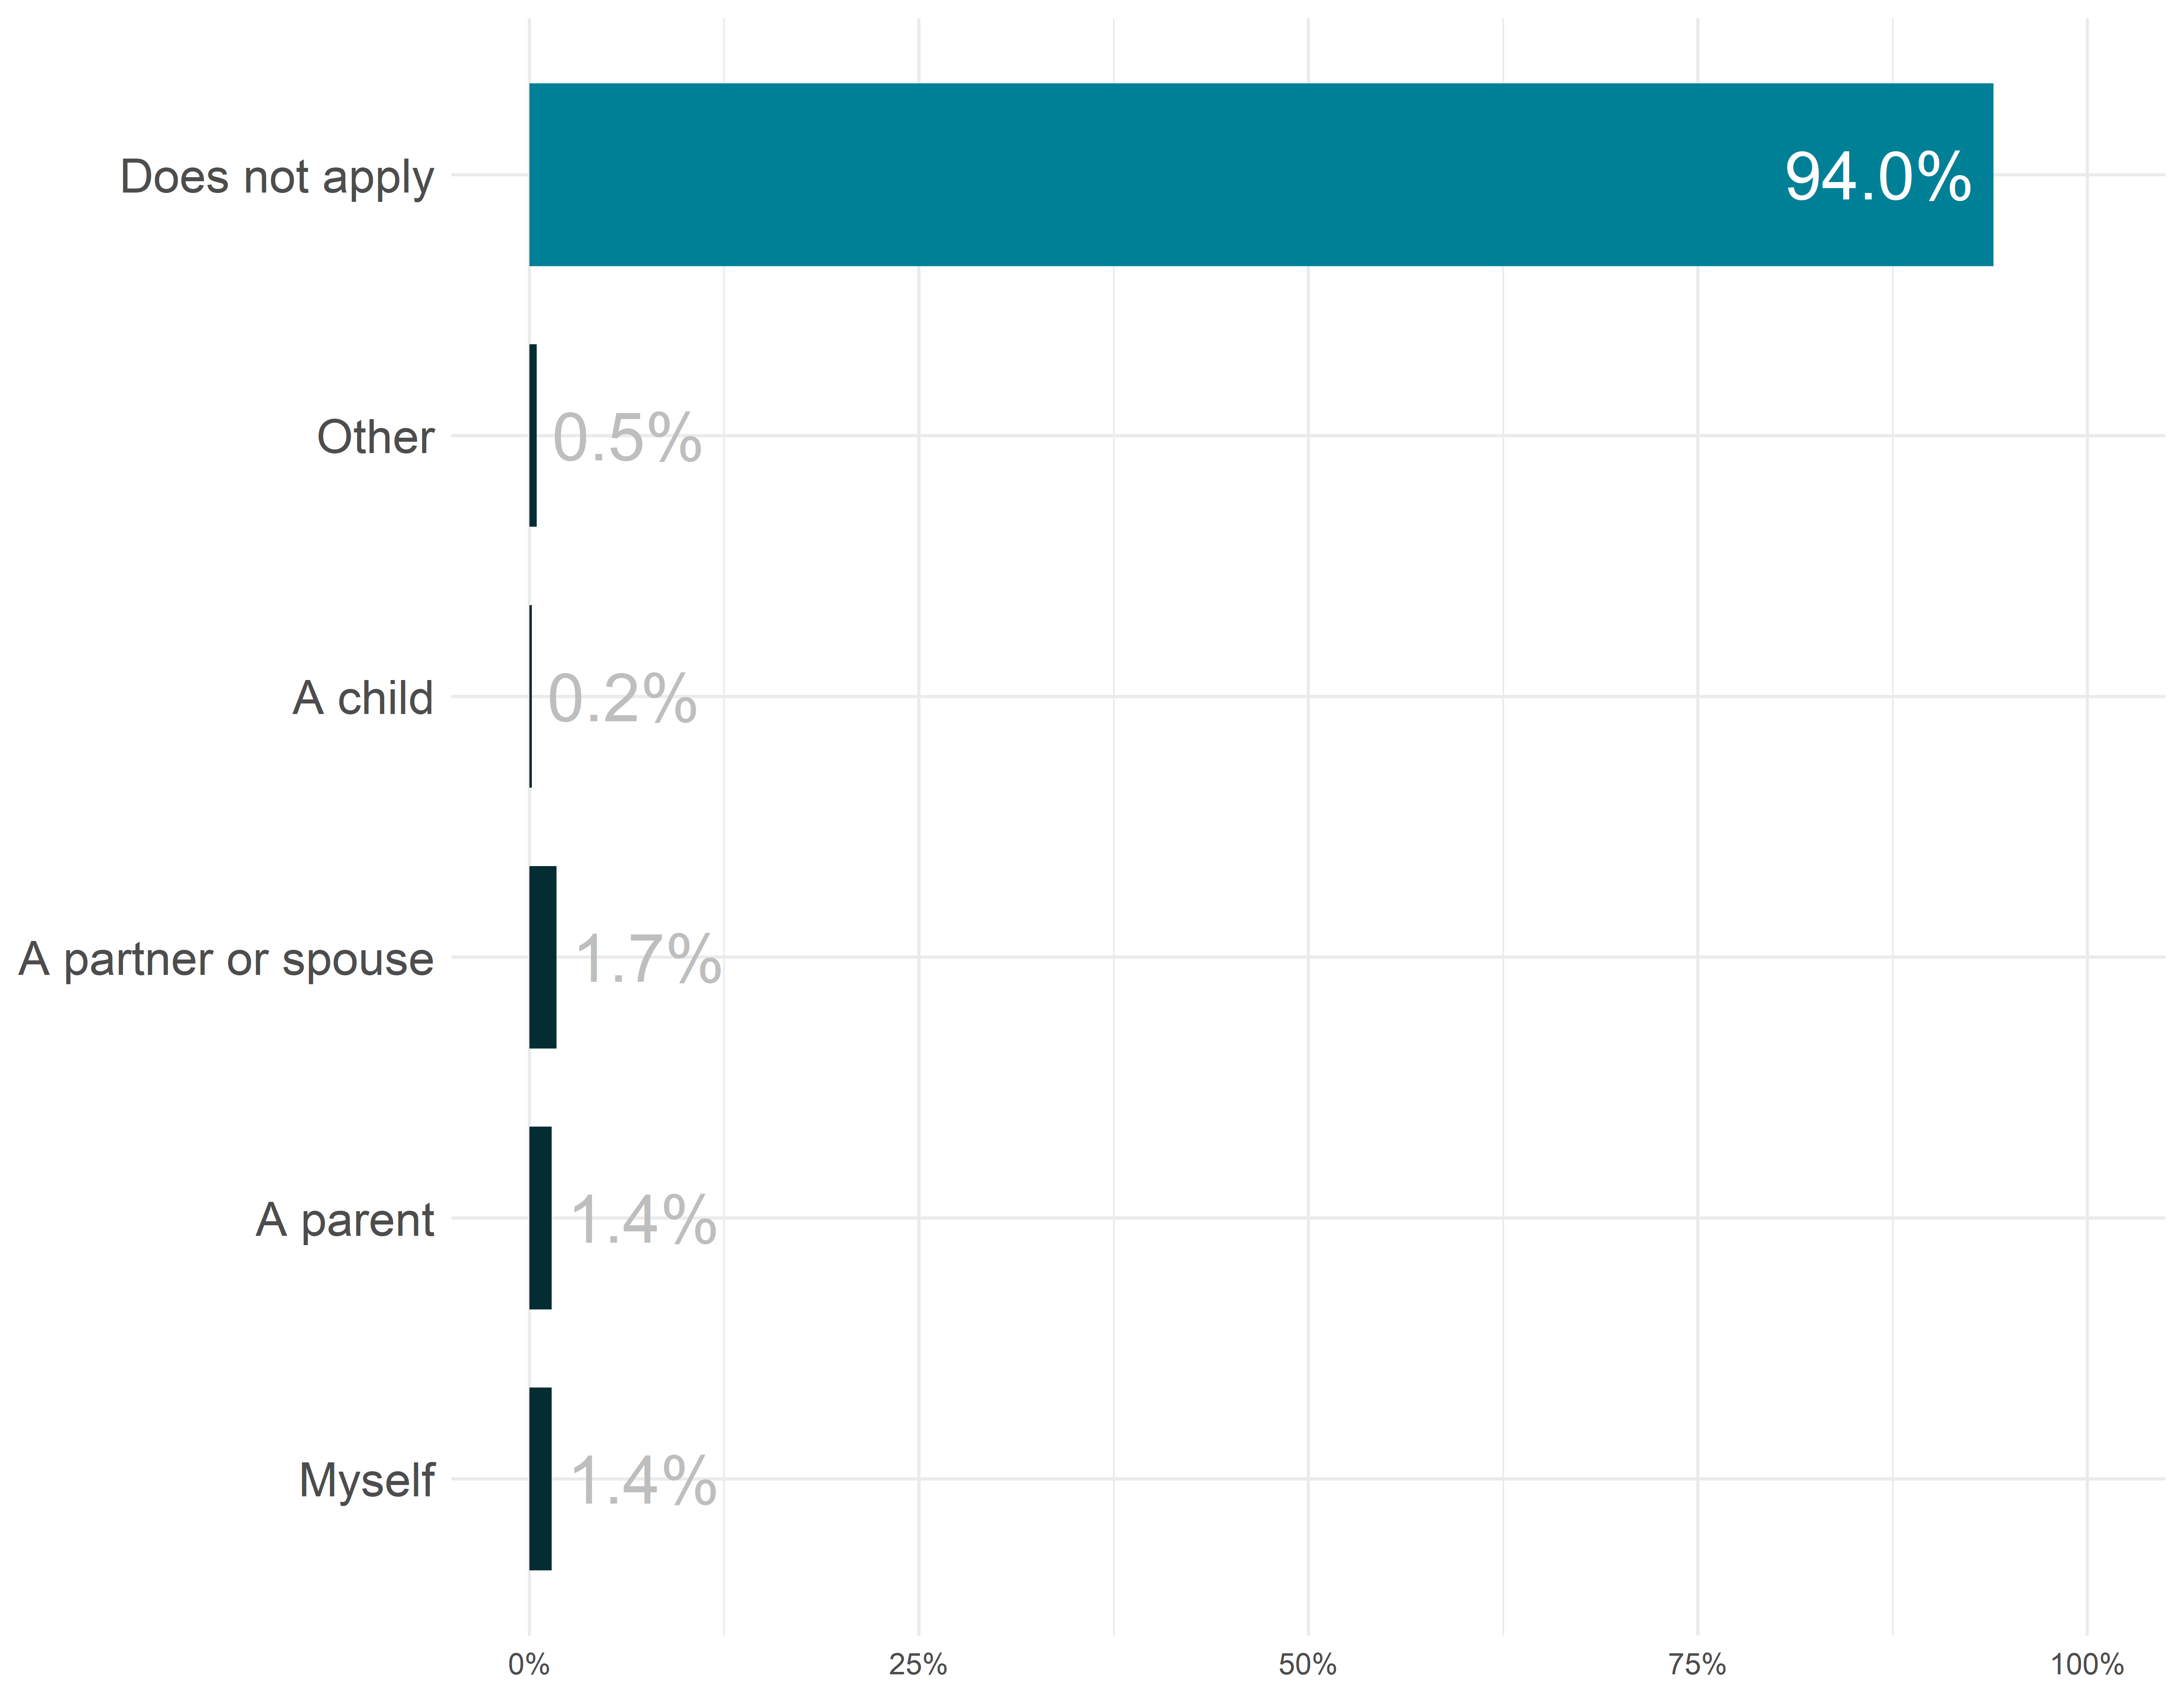
During the past three months, has any member of your household spent at least one night in jail or prison?
Rate of response: 100.0%
Community and wellbeing
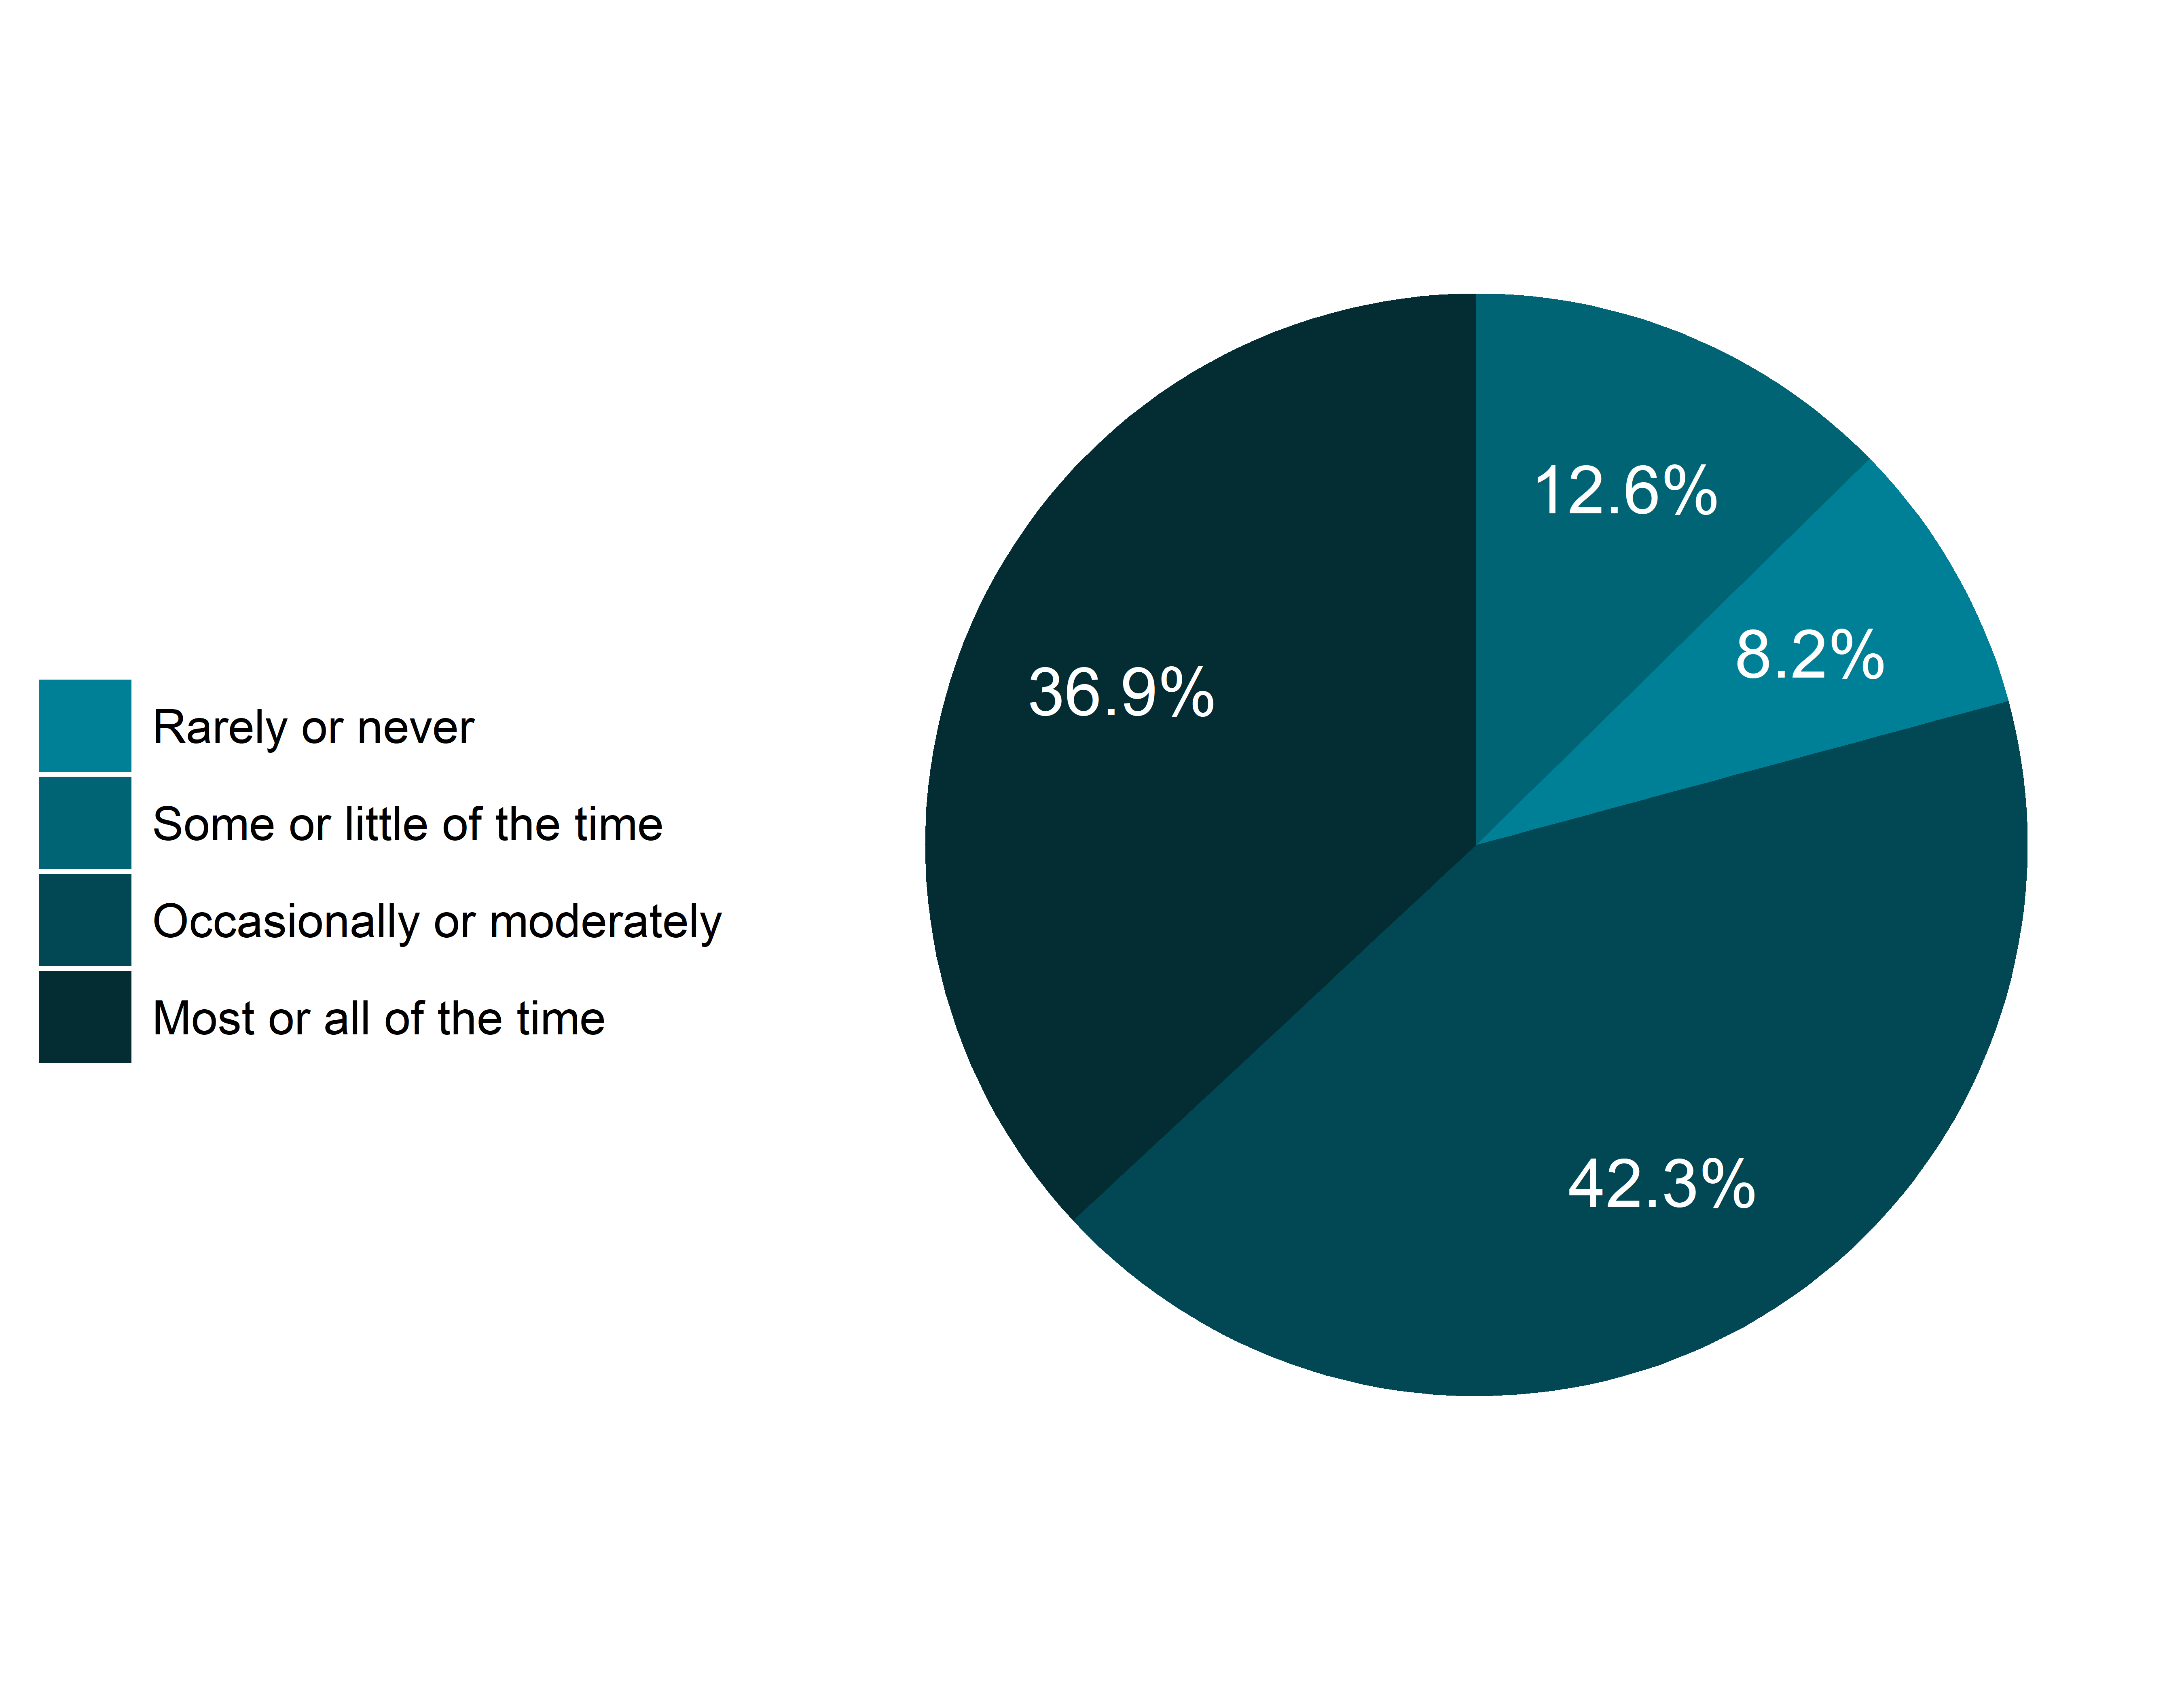
CPAL.CESD.001.b
In the past month, please describe how often you felt hopeful about the future
Rate of response: 95.5%
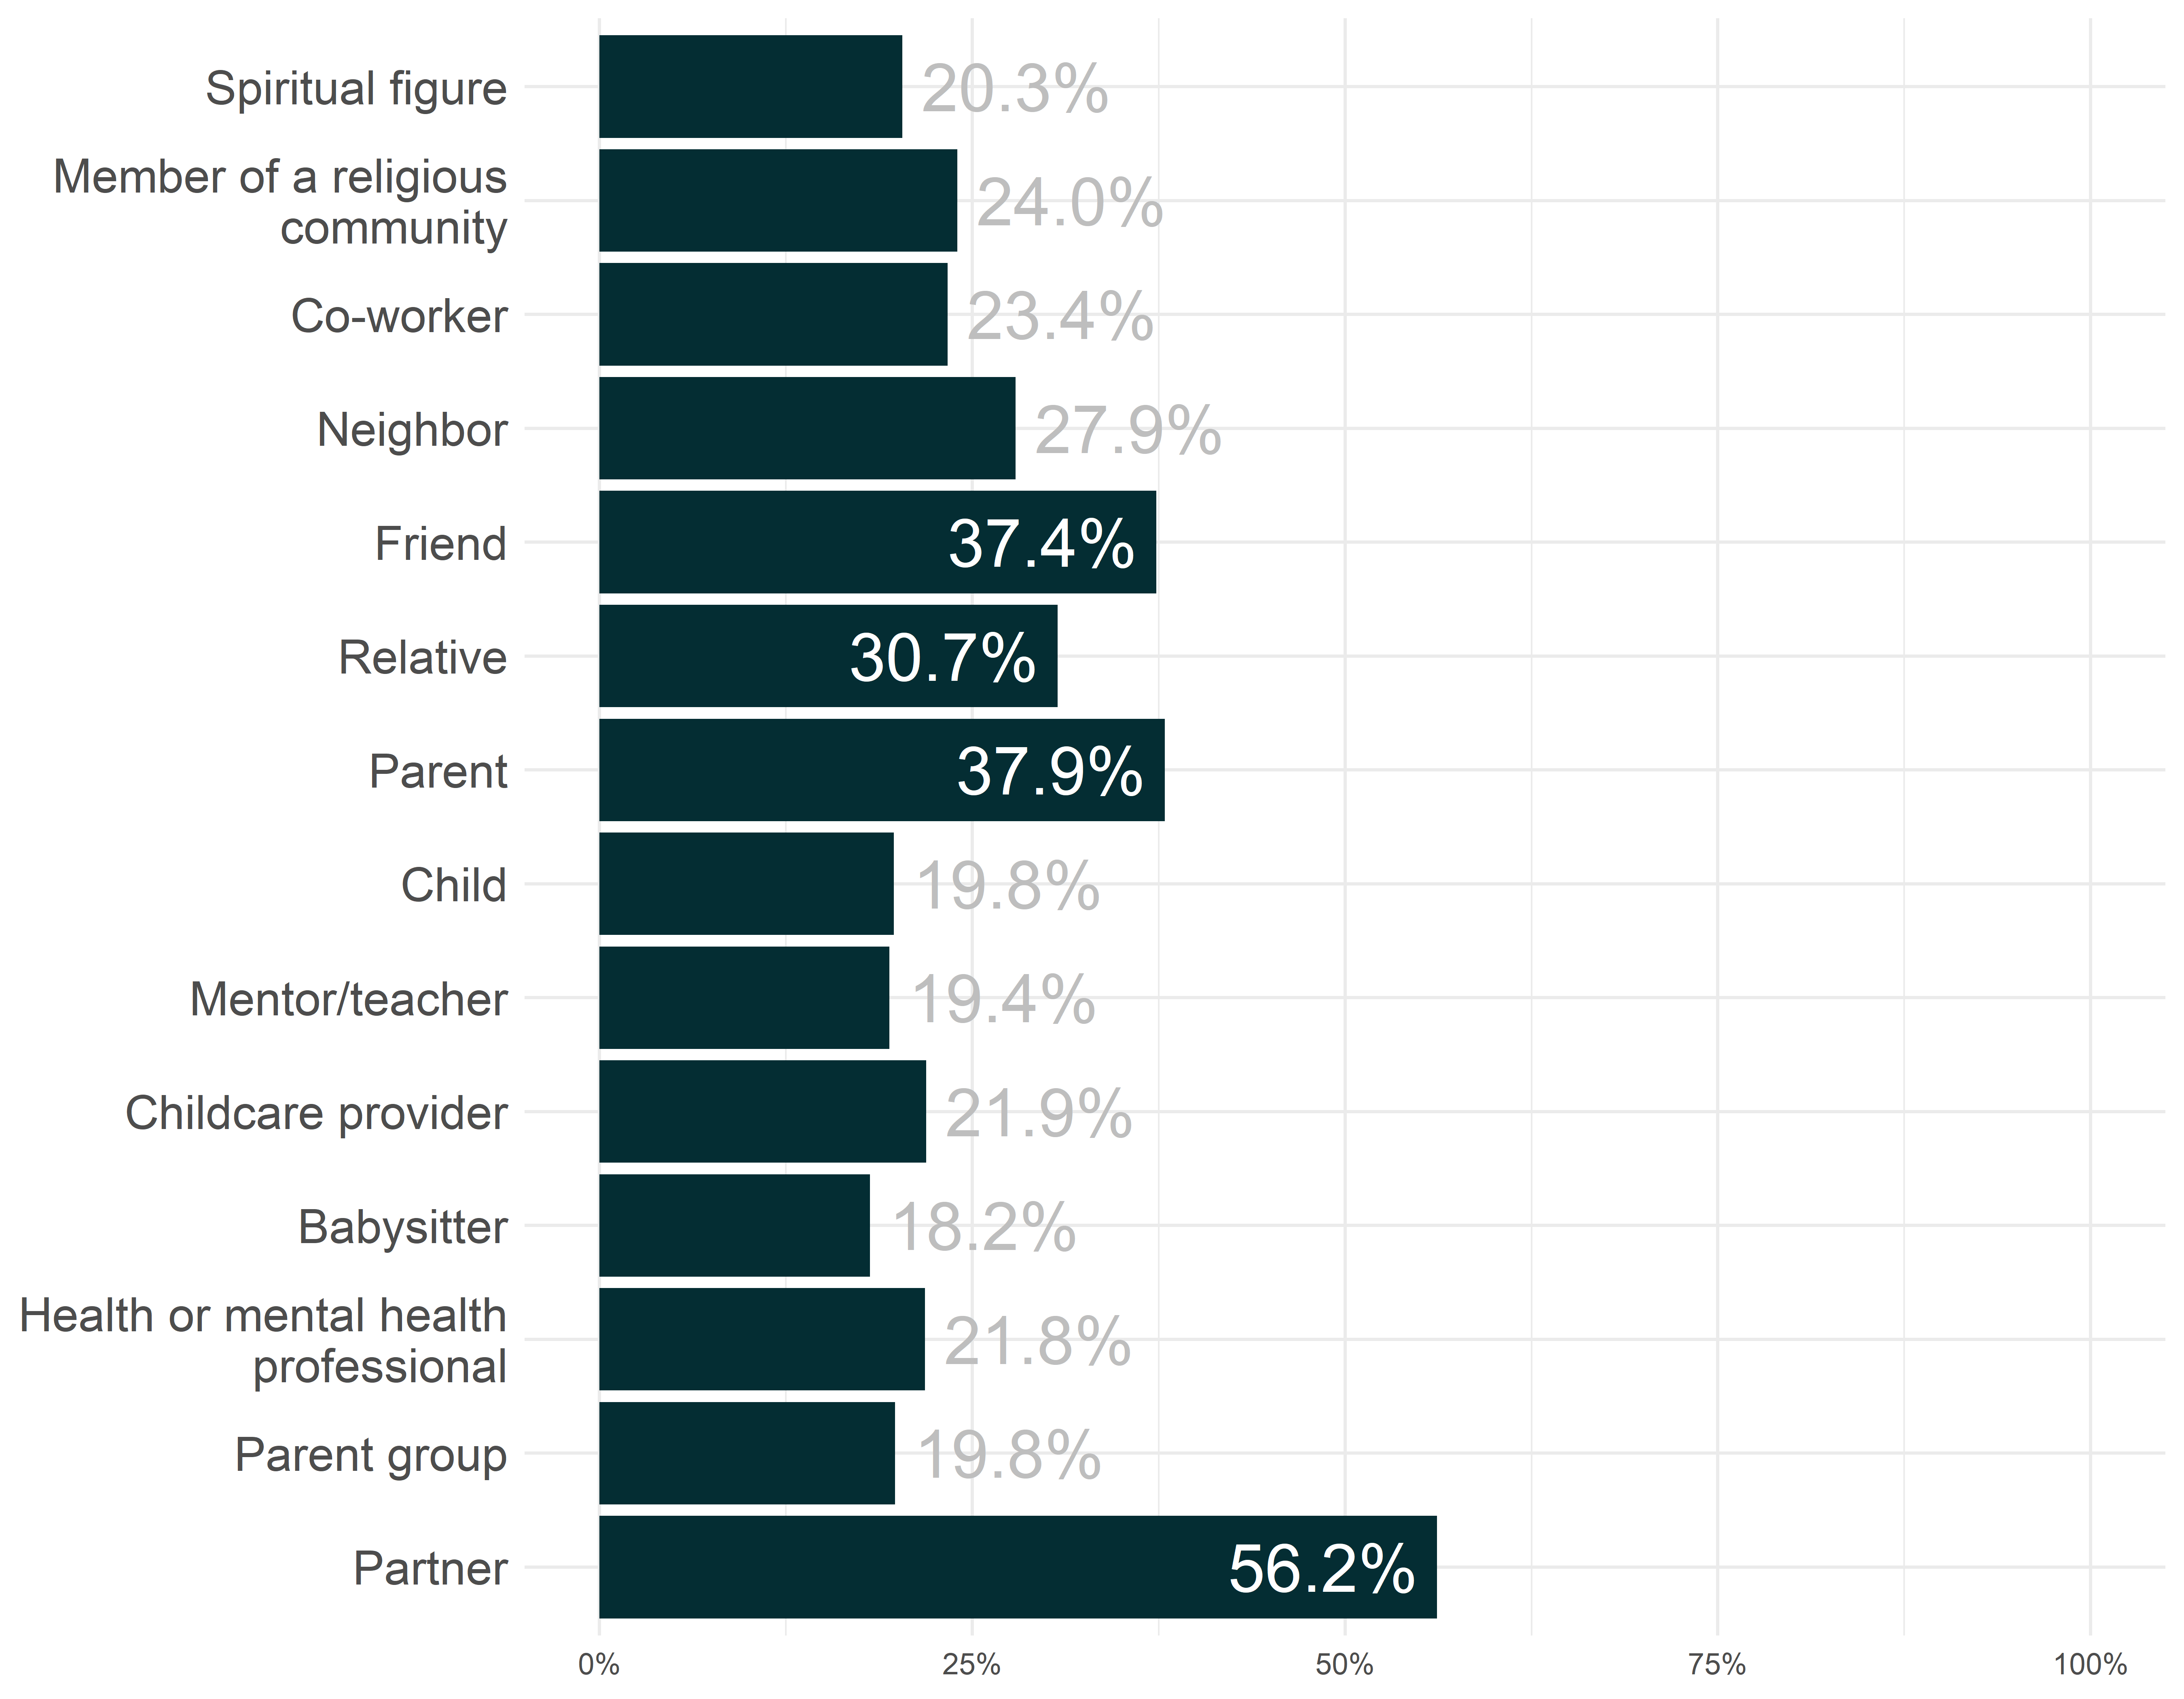
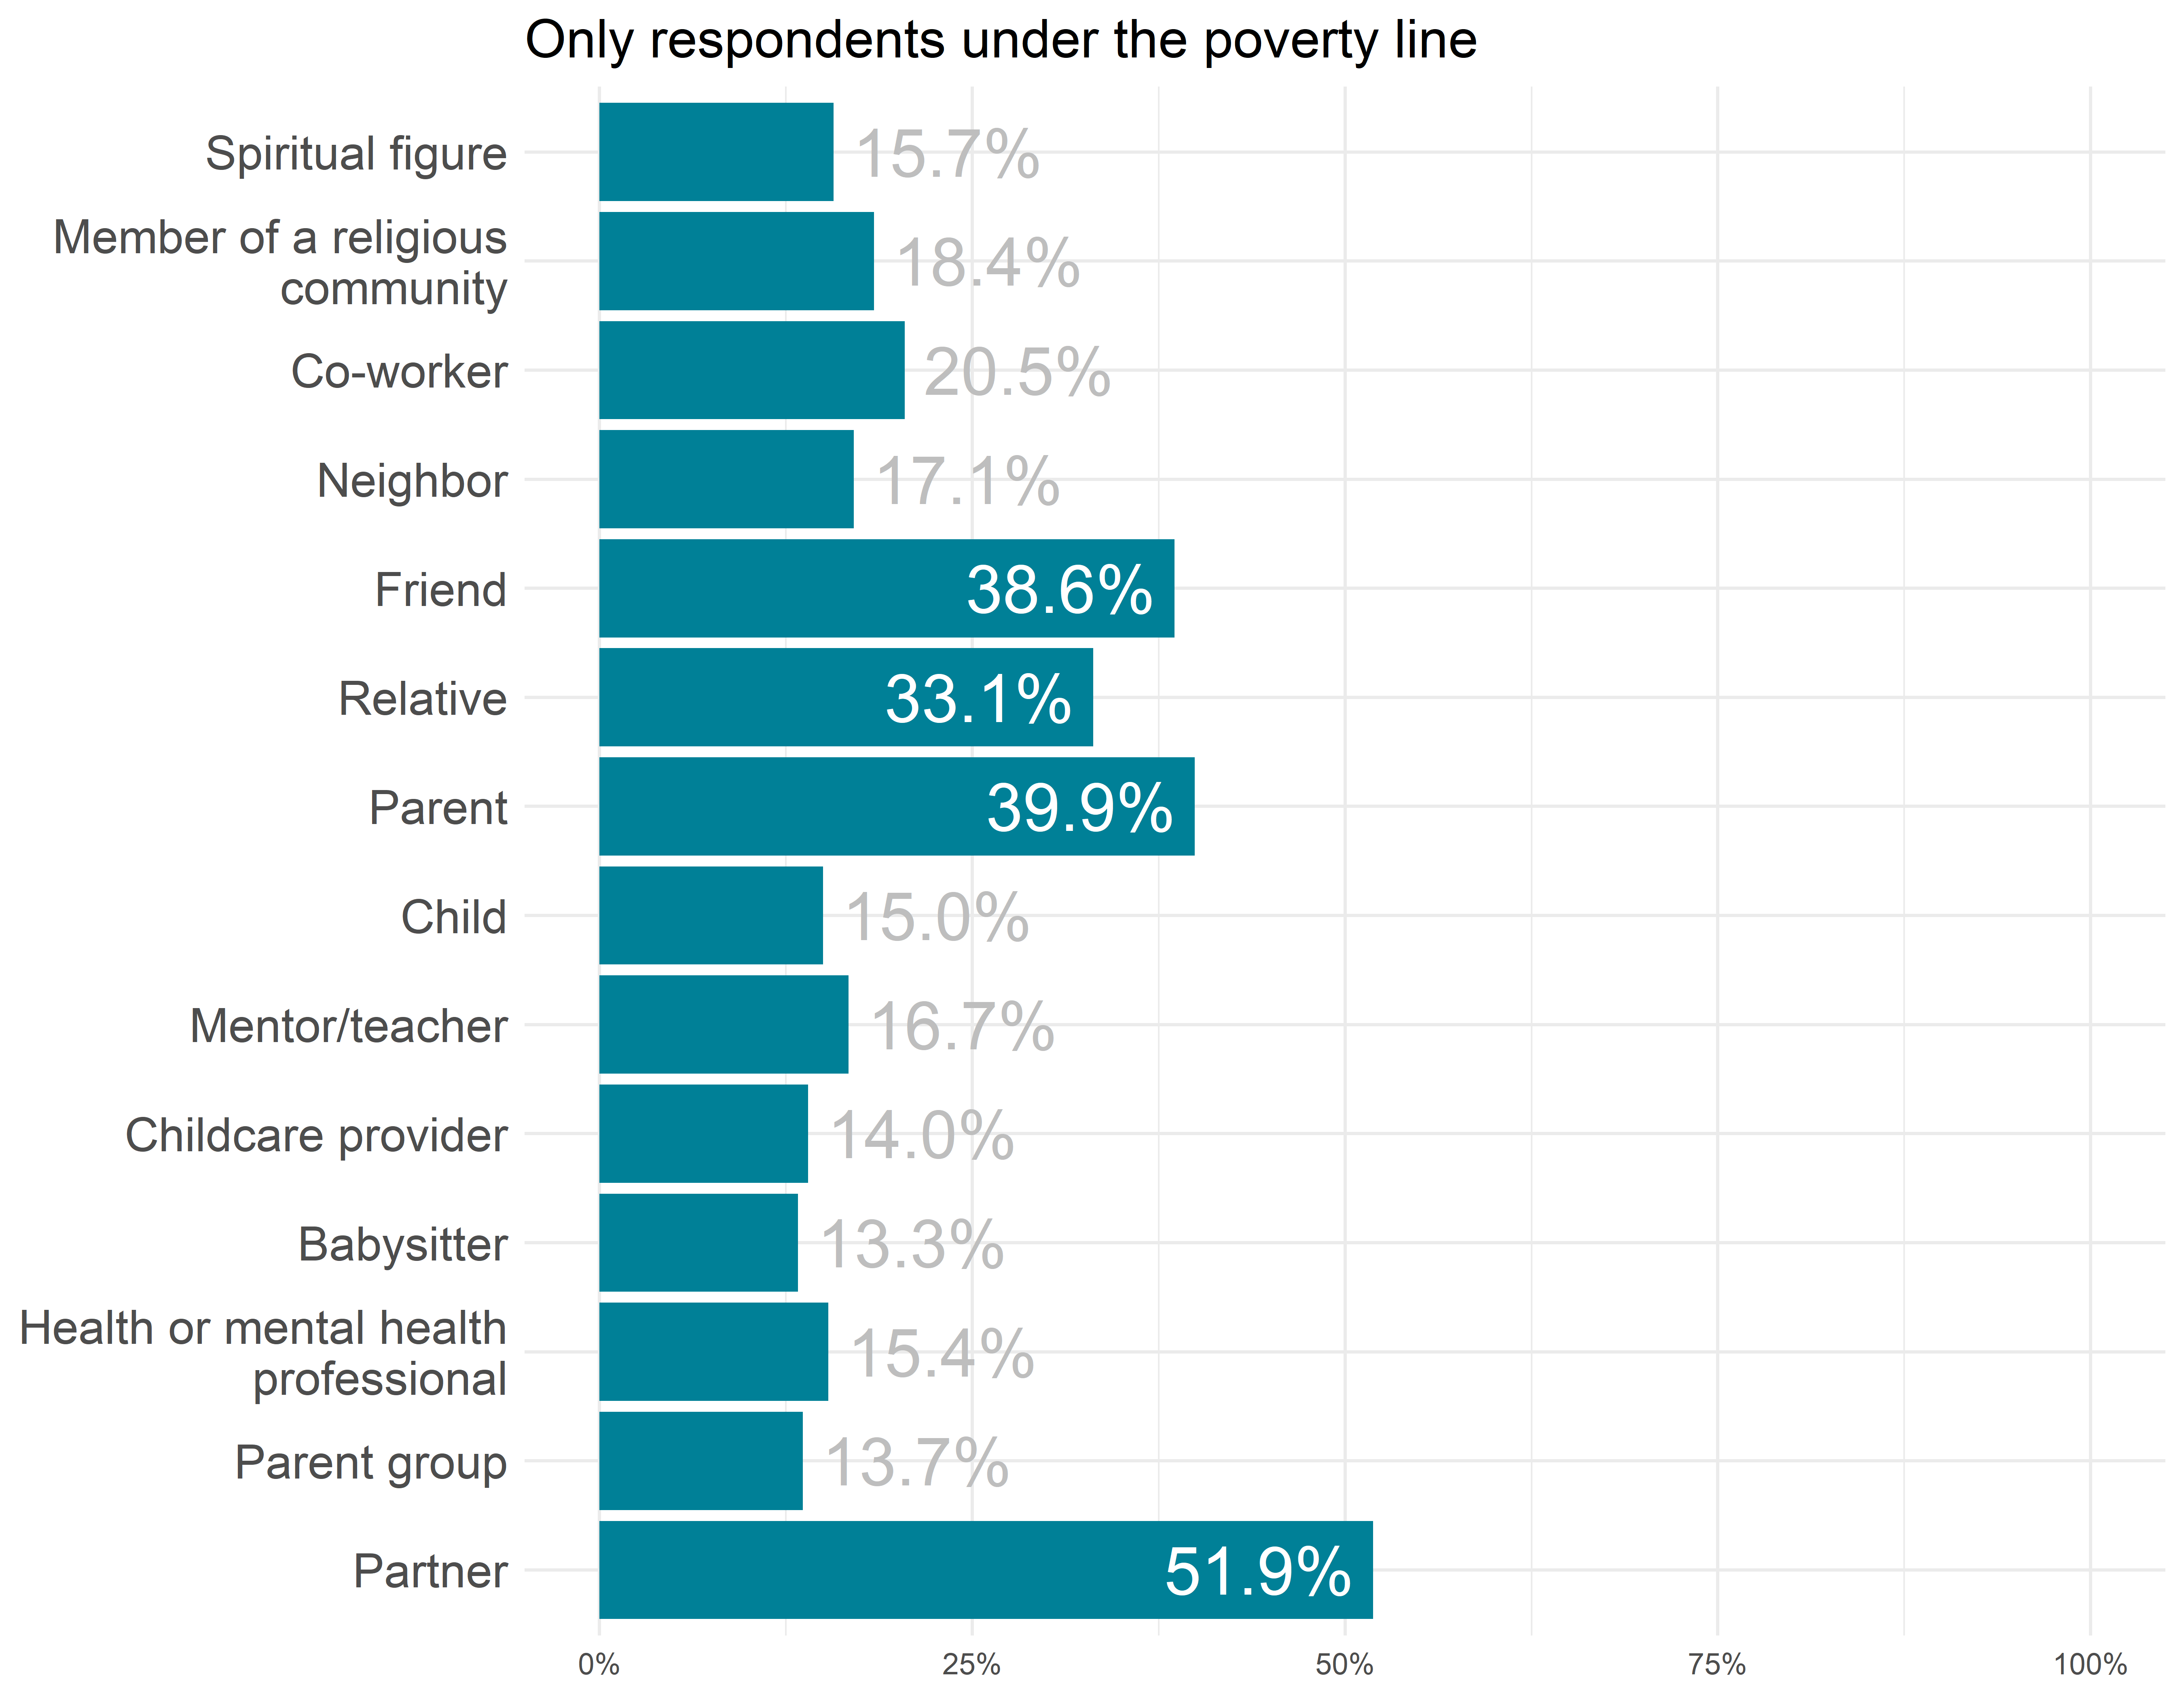
CPAL.SOCIALSUPP.003.a
Who do you turn to for social support? Think about who you turned to for social support in this last week.
Rate of response: 100.0%
CPAL.DALLASCORE.002
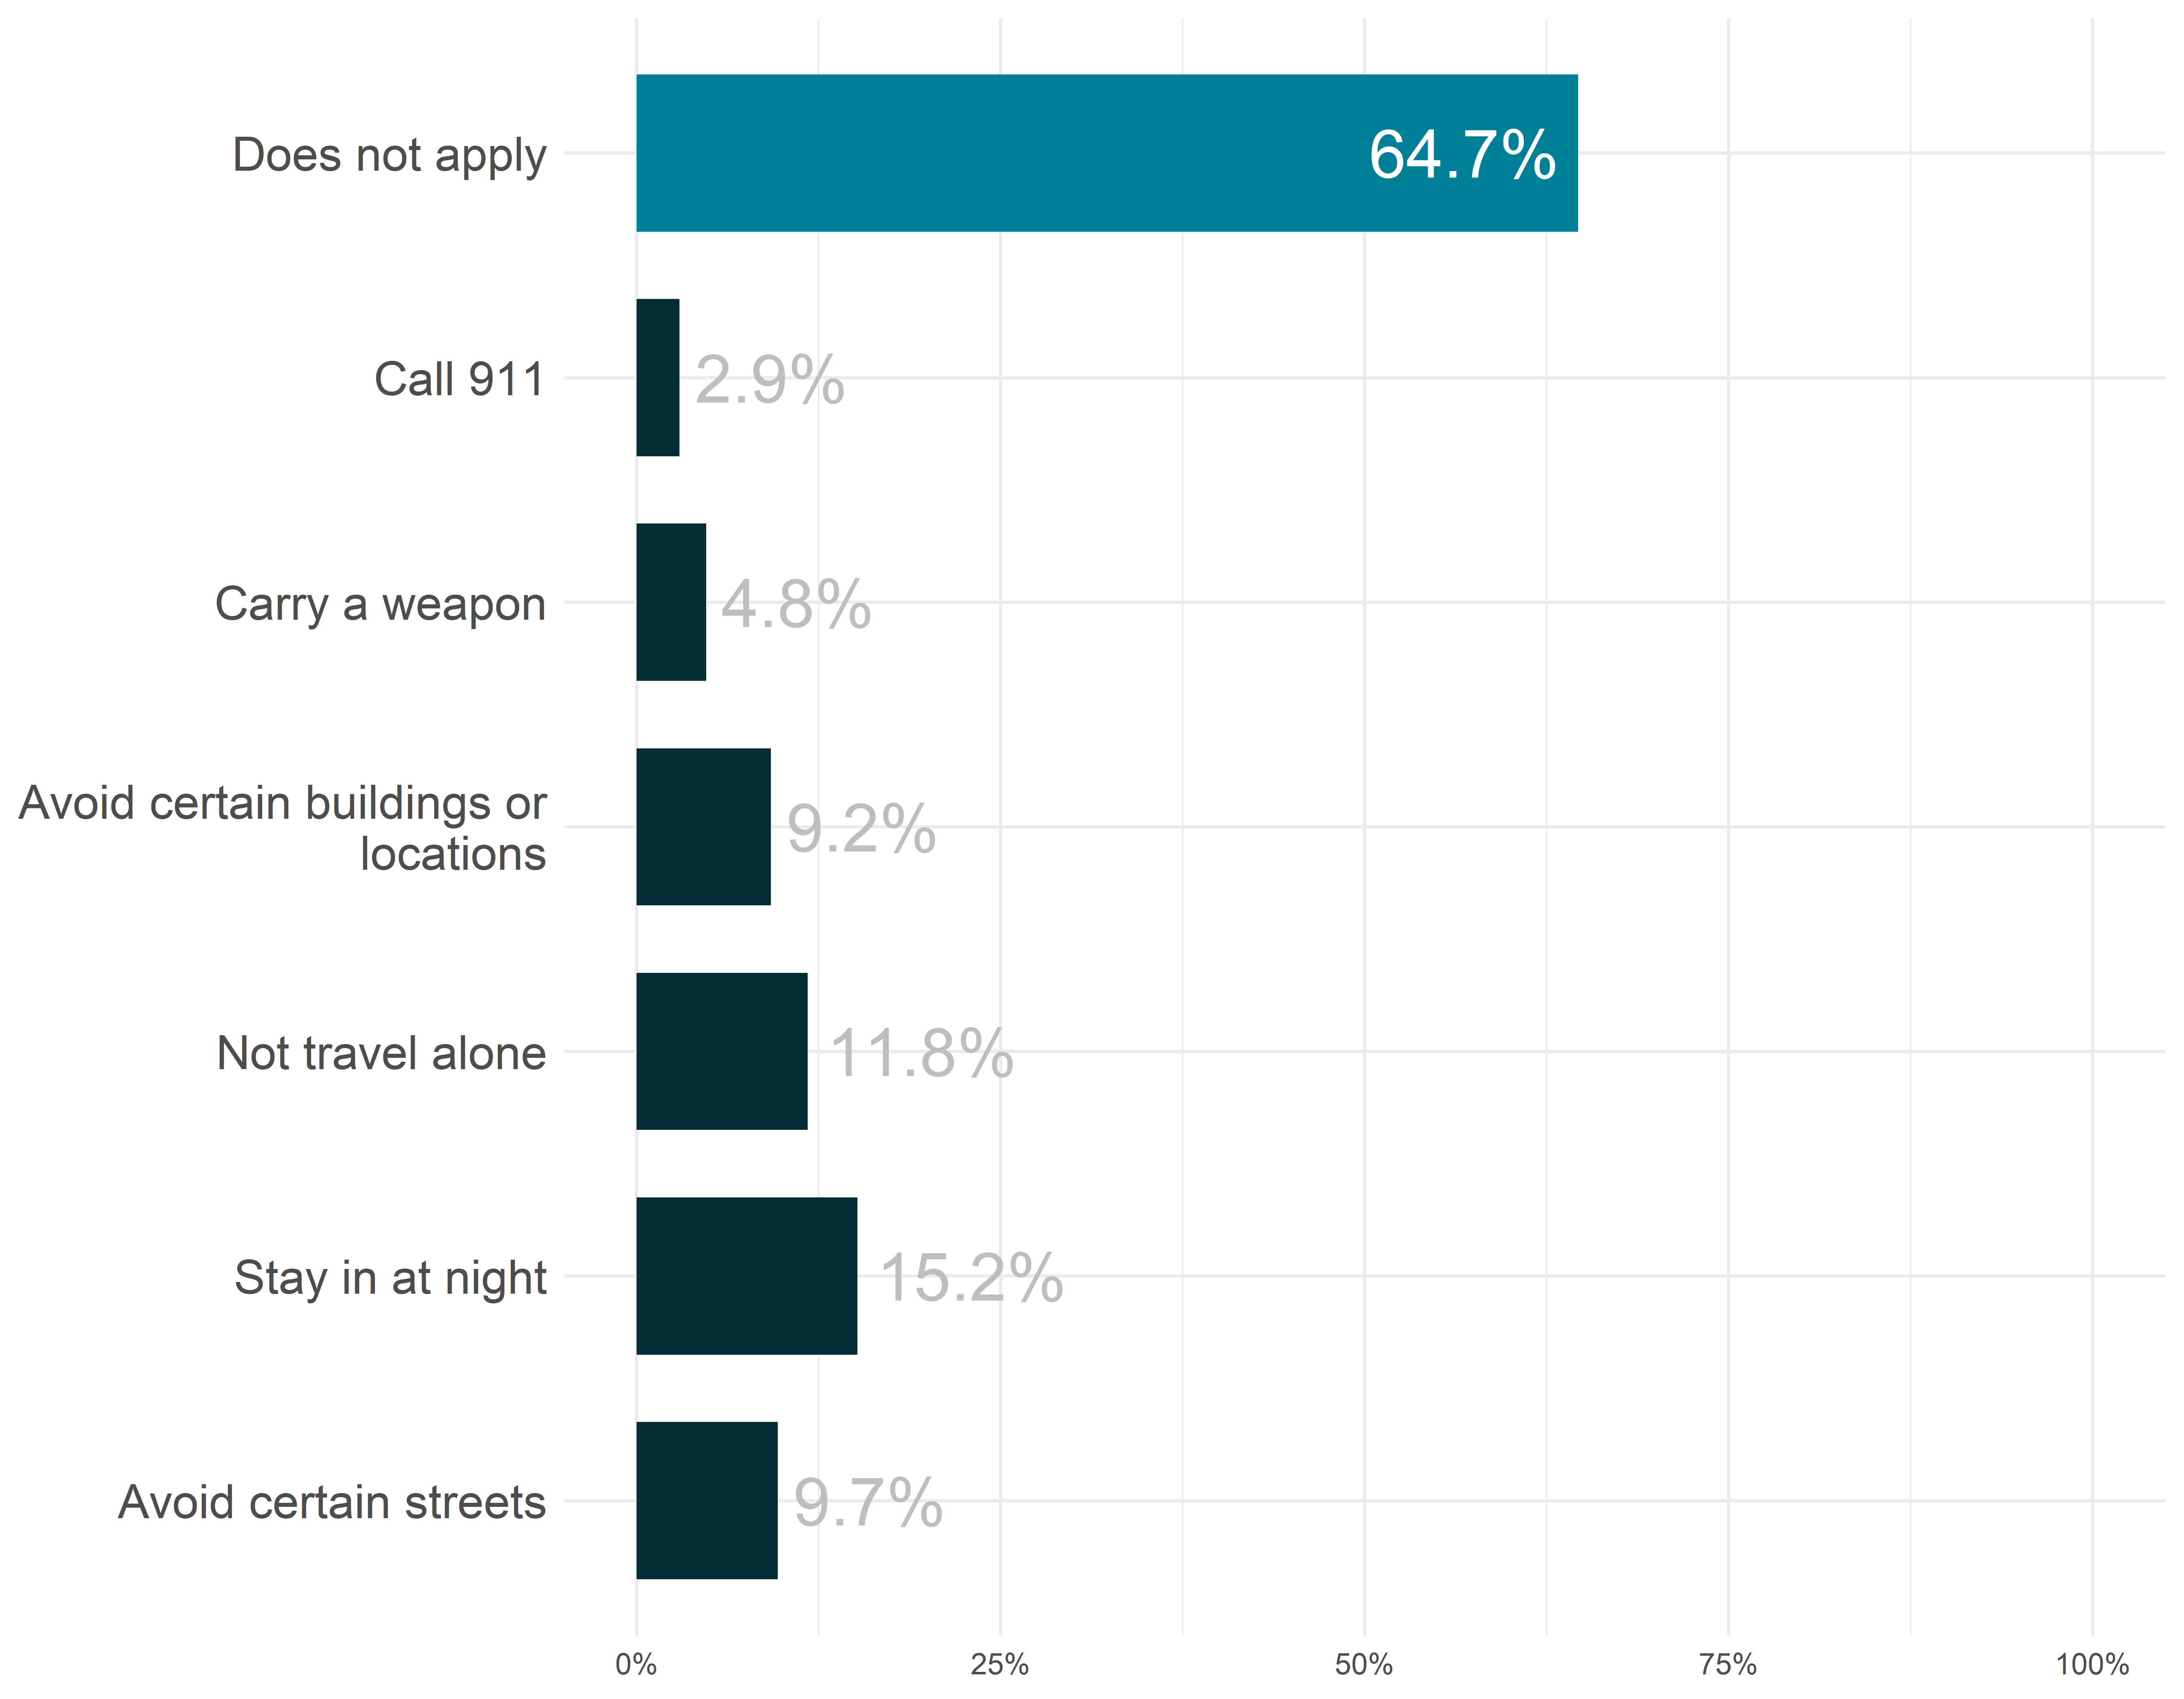
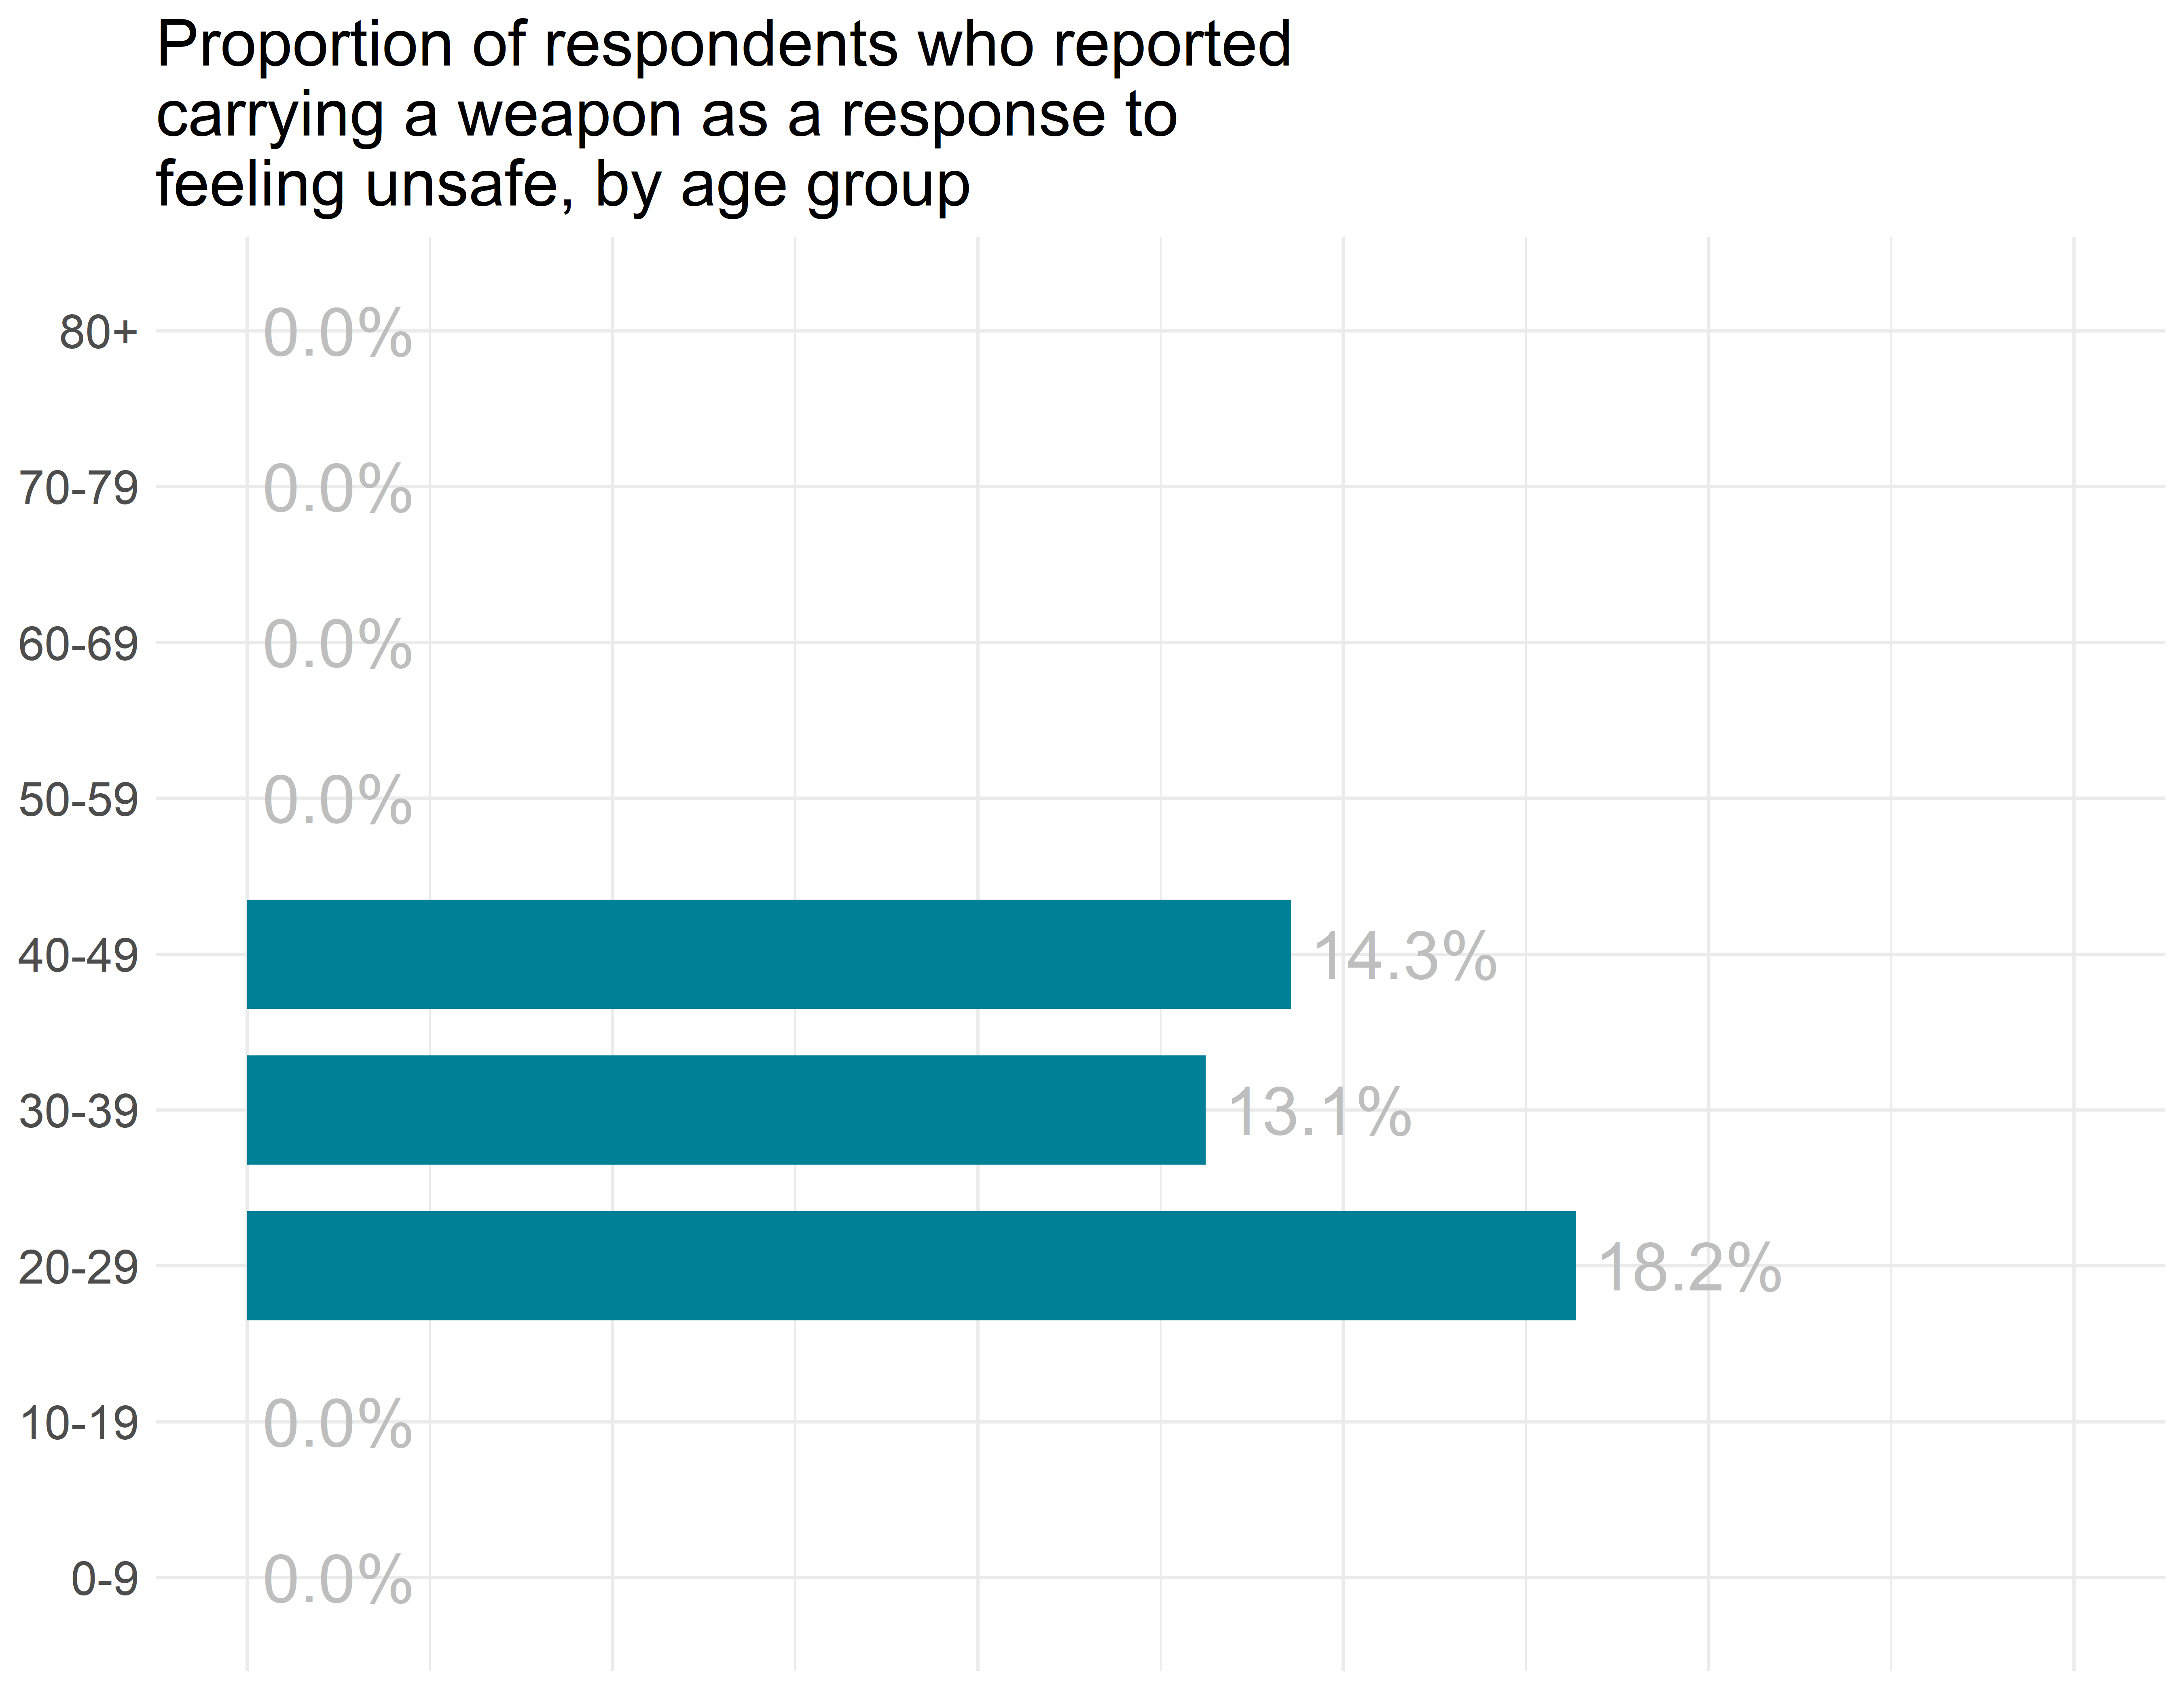
In the past 3 months, have you done any of the following out of concern for your own safety while in your neighborhood?
Rate of response: 100.0%
